| 0 |
| Votes |
|
| 0 |
| Answers |
|
| 961 |
| Views |
|
💥The Moving Average Convergence Divergence (MACD) is a technical analysis indicator that helps traders identify potential buying ...
|

12/22/2022
To last
|
|
| 0 |
| Votes |
|
| 0 |
| Answers |
|
| 943 |
| Views |
|
The formula used to calculate the Price Oscillator is: short-term MA minus long-term MA. 💥The P...
|

12/20/2022
To last
|
|
| 0 |
| Votes |
|
| 0 |
| Answers |
|
| 934 |
| Views |
|
💥In the previous section, we discussed shifting the moving average up and down to form a band that helps filter out false signals. Using the sam...
|

12/19/2022
To last
|
|
| 0 |
| Votes |
|
| 0 |
| Answers |
|
| 917 |
| Views |
|
💥Moving Average (MA) is a popular technical analysis tool that is used to smooth out price action and identify trends. It is calculated by averaging a selected number of prices, usually closing price...
|

12/18/2022
To last
|
|
| 0 |
| Votes |
|
| 0 |
| Answers |
|
| 957 |
| Views |
|
Simple Moving Average (SMA)
💥Moving averages are one of the most commonly used technical indicator...
|

12/18/2022
To last
|
|
| 0 |
| Votes |
|
| 0 |
| Answers |
|
| 904 |
| Views |
|
💥Using two moving averages can provide more precise buy and sell signals as well as act as support and resistance levels in both uptrends an...
|

12/13/2022
To last
|
|
| 0 |
| Votes |
|
| 0 |
| Answers |
|
| 529 |
| Views |
|
|

12/10/2022
To last
|
|
| 0 |
| Votes |
|
| 0 |
| Answers |
|
| 821 |
| Views |
|
💥A moving average is a commonly used technical indicator in financial market analysis that helps to smooth out price data by creating a ...
|

12/10/2022
To last
|
|
| 0 |
| Votes |
|
| 0 |
| Answers |
|
| 811 |
| Views |
|
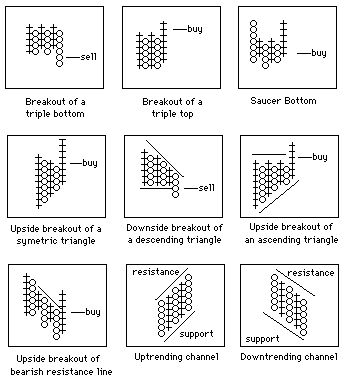
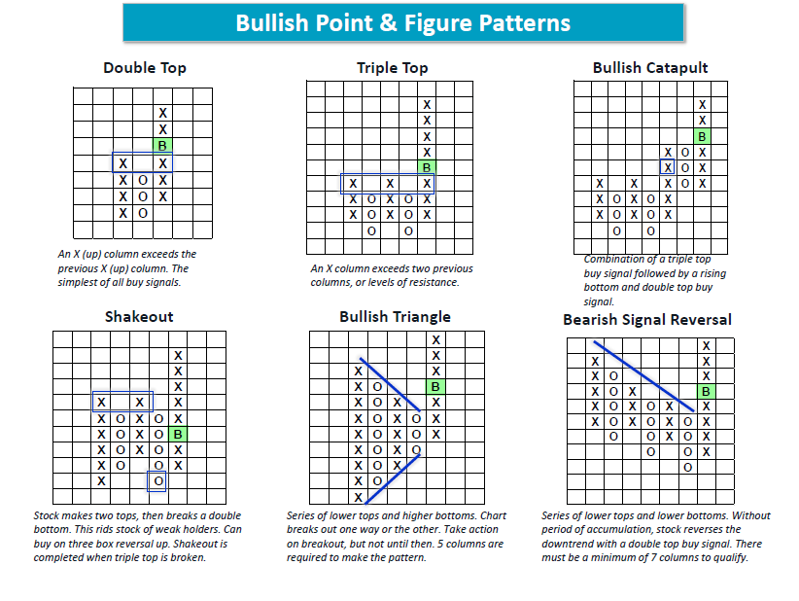
💥The Point-and-Figure diagram is a popular tool among technical analysts and traders for chart...
|

12/5/2022
To last
|
|
| 0 |
| Votes |
|
| 0 |
| Answers |
|
| 1030 |
| Views |
|
[center]   [img=135956]b09223ca-7e94-42ac-b1e7-a769735a6b19.png[/...
|

12/4/2022
To last
|