| 0 |
| Votes |
|
| 0 |
| Answers |
|
| 1153 |
| Views |
|
Candlestick patterns are one of the most common tools in technical analysis. They help traders recognize potential market movements based on combinations of candles on the price chart. In this article...
|

9/26/2024
To last
|
|
| 0 |
| Votes |
|
| 0 |
| Answers |
|
| 1084 |
| Views |
|
[center]   [img=135956]b09223ca-7e94-42ac-b1e7-a769735a6b19.png[/...
|

12/4/2022
To last
|
|
| 0 |
| Votes |
|
| 0 |
| Answers |
|
| 999 |
| Views |
|
💥The inverted head and shoulders pattern is a chart pattern that signals a potential reversal of a downtrend. It is formed by three lows, with the middle low (the head) being lower than the other two...
|

11/21/2022
To last
|
|
| 0 |
| Votes |
|
| 0 |
| Answers |
|
| 1095 |
| Views |
|
💥A rectangle is a chart pattern that signals a period of consolidation in the price movement of an asset. The pattern is formed when the price moves between parallel support and resistance levels, cr...
|

11/20/2022
To last
|
|
| 0 |
| Votes |
|
| 0 |
| Answers |
|
| 995 |
| Views |
|
💥Flags and Pennants are two chart patterns that can occur during a trend, typically after a significant price movement. They are classified as continuation patterns as they suggest that the previous ...
|

11/18/2022
To last
|
|
| 0 |
| Votes |
|
| 0 |
| Answers |
|
| 1355 |
| Views |
|
💥Broadening formation, also known as megaphone or expanding triangle, is a chart pattern characterized by two trend lines that are diverging from each other. The top trend line represents the resista...
|

11/17/2022
To last
|
|
| 0 |
| Votes |
|
| 0 |
| Answers |
|
| 966 |
| Views |
|
💥A descending triangle is a chart pattern in technical analysis that is formed when the price of an asset moves within a converging range, with a downward-sloping trend line at the top and a horizont...
|

11/15/2022
To last
|
|
| 0 |
| Votes |
|
| 0 |
| Answers |
|
| 998 |
| Views |
|
💥A symmetric triangle is a type of continuous pattern in technical analysis that occurs when the price of an asset moves within a converging range, forming two trend lines that meet at a point. This ...
|

11/13/2022
To last
|
|
| 0 |
| Votes |
|
| 0 |
| Answers |
|
| 3719 |
| Views |
|
💥Continuous patterns are chart patterns that indicate that the price of an asset is likely to continue moving in the same direction as the current trend. These patterns are characterized by a series ...
|

11/12/2022
To last
|
|
| 0 |
| Votes |
|
| 0 |
| Answers |
|
| 1199 |
| Views |
|
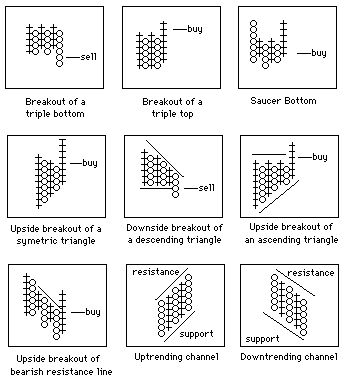
💥The Saucer pattern is a bullish trend reversal pattern that is characterized by a gentle and rounded bottom formation on a chart. It is also known as the "rounded bottom" pattern. The pattern indica...
|

11/10/2022
To last
|