
 Русский
 中文
中文
 Español
 Deutsch
 Português
 日本語
日本語
💥A descending triangle is a chart pattern in technical analysis that is formed when the price of an asset moves within a converging range, with a downward-sloping trend line at the top and a horizontal support line at the bottom. This pattern is a bearish continuation pattern, which means that it is likely to result in the continuation of an existing downtrend once the pattern is broken.
💥To identify a descending triangle pattern, traders look for a horizontal support line and a downward-sloping trend line that connects at least two highs. The support line should be roughly flat, while the trend line should slope downwards. These lines should converge towards a point.
💥Traders often look for a breakout below the support line to confirm the pattern, as this indicates that sellers have gained enough momentum to push the price below the support level. They may also use other technical indicators and analysis to confirm the direction of the breakout and determine potential entry and exit points for trades.
💥Once the price breaks out of the descending triangle pattern, it is likely to continue moving downwards, with a potential price target equal to the height of the pattern subtracted from the breakout point. However, if the price fails to break out and instead rises above the downward-sloping trend line, the pattern is considered to be invalidated.
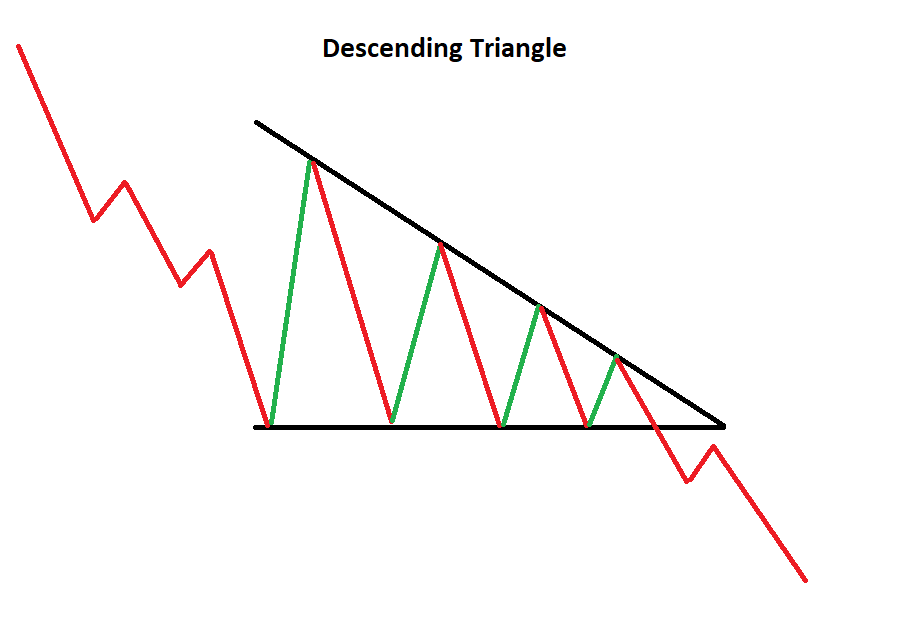
💥Descending Triangle (see picture) is similar to triple bottoms, but the difference is that new tops are present during the formation of the pattern. For example, top 3 is below top 2 and top 2 is below top 1. This pattern is a correction before continuing to decline following the pattern of a downtrend.
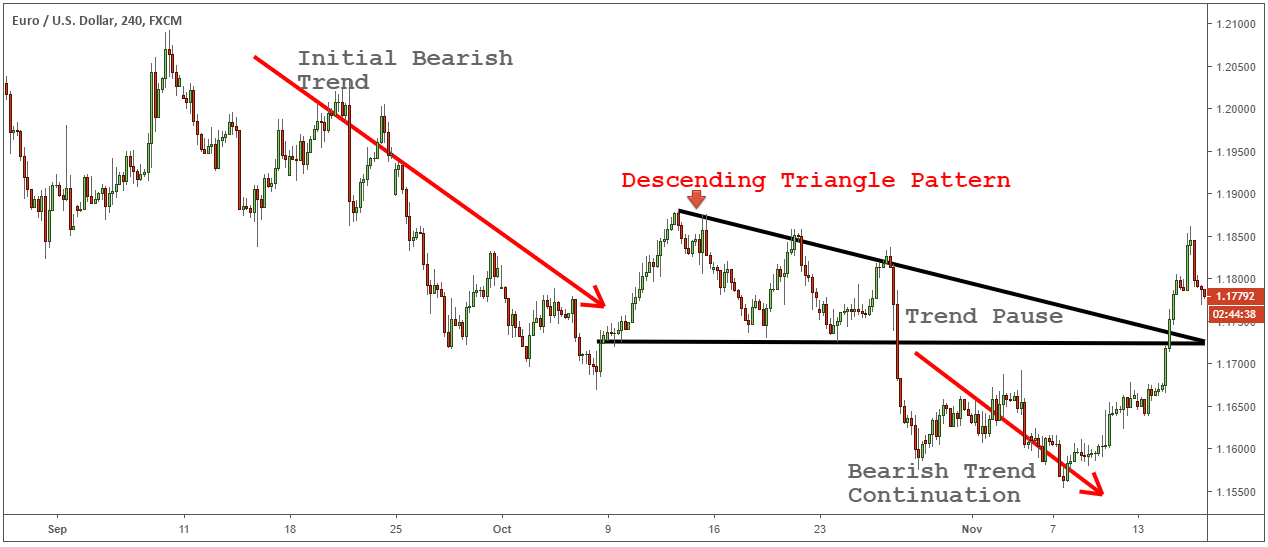
💥In the example shown in the picture, past volume price movements have formed a descending triangle, including finding targets. When the price reaches the target level, the stock price has a noticeable rebound. During the formation of the pattern, there was a time when the support line flattened, which can be seen as a downtrend during that period. However, the volume price returned to the range of the pattern once again before falling off. The support level is somewhat more complete.
💥If the rules of Fibonacci numbers are applied, it can be seen that the weakening of the volume price comes down to test the flat support line, which is about two-thirds of the way from the base to the top. It will be even more possible that the volume price at that time dropped really come down!
Comments (0)
Login or Create account, Log in or register to leave a comment
No comments yet. Be the first!