
 Русский
 中文
中文
 Español
 Deutsch
 Português
 日本語
日本語
💥A symmetric triangle is a type of continuous pattern in technical analysis that occurs when the price of an asset moves within a converging range, forming two trend lines that meet at a point. This pattern indicates a period of consolidation in the market, where neither buyers nor sellers have enough momentum to push the price in a definitive direction.
💥Symmetric triangles are considered a continuation pattern, which means that they are likely to result in a continuation of the previous trend once the pattern is broken. If the trend was bullish, the price is likely to continue moving upwards after breaking out of the triangle. If the trend was bearish, the price is likely to continue moving downwards after breaking out of the triangle.
💥To identify a symmetric triangle pattern, traders look for two trend lines that connect at least two highs and two lows. The upper trend line connects the highs, while the lower trend line connects the lows. These lines should be roughly parallel to each other and converge towards a point.
💥Traders often look for a breakout above the upper trend line or below the lower trend line to confirm a continuation of the previous trend. They may also use other technical indicators and analysis to confirm the direction of the breakout and determine potential entry and exit points for trades.
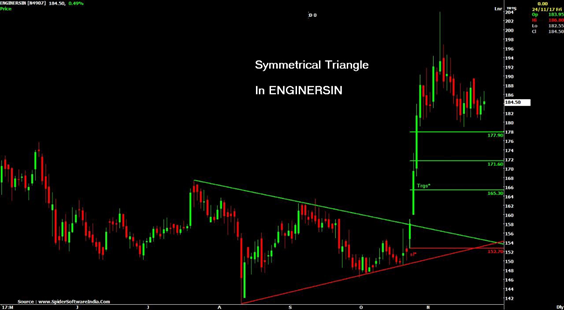
💥If you look at the image above, you can see that the original price trend was an uptrend. However, at point 1 (green line), the price dropped down to point 1 (red line), providing an opportunity for buyers to enter the market and causing the price to rebound back up to point 2 (green line). But selling pressure pushed it down again to point 2 (red line), forming a triangular pattern. It's called a symmetric triangle because the trend line passes through the apex point (green line) and the trend drawn through the bottom of the pattern (red line) forms equal angles with the plane. The point where the green and red lines meet is called the apex. When the price breaks through the triangle, the trend is likely to continue in an uptrend, and the break usually occurs two-thirds of the way from the apex to the base. However, if it breaks past that point, the probability of a break up or break down becomes equal, and it may cause a reversal.
💥After a break up, it can be analyzed that the price may continue to go up to a distance equal to the base of the triangle or from the apex point up to the same distance. Another popular method is to draw a line parallel to the red line from point 1 (green line), which can also be used as another target line.
💥Using the example of the chart image above, we can see a volume price movement that forms a symmetric triangle. Some parts of the price fall off the lower boundary of the triangle, but if we observe it carefully, we can see that the closing price can move back into the pattern, so we can still consider this as a symmetric triangle pattern.
Comments (0)
Login or Create account, Log in or register to leave a comment
No comments yet. Be the first!