
 Русский
 中文
中文
 Español
 Deutsch
 Português
 日本語
日本語
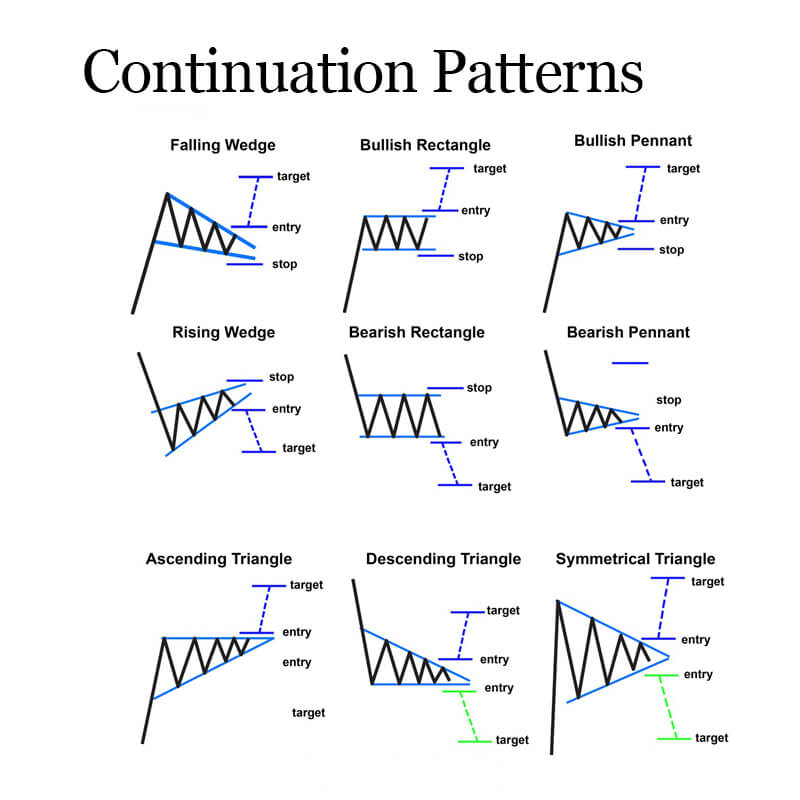
💥Continuous patterns are chart patterns that indicate that the price of an asset is likely to continue moving in the same direction as the current trend. These patterns are characterized by a series of price movements that are similar in shape and direction to each other.
💥There are two main types of continuous patterns: the bullish and bearish patterns. Bullish patterns indicate that the price is likely to continue moving upwards, while bearish patterns suggest that the price is likely to continue moving downwards.
💥Some common examples of bullish continuous patterns include the ascending triangle, the bull flag, and the cup and handle pattern. Bearish continuous patterns include the descending triangle, the bear flag, and the head and shoulders pattern.
💥Traders often use these patterns to help them make decisions about when to enter or exit trades. It is important to note, however, that not all patterns will be successful and other indicators and analysis should also be used to confirm the trend before making a trade.
💥Continuous patterns are very important in technical analysis as they provide valuable information about the trend of an asset. By identifying and analyzing these patterns, traders and investors can make informed decisions about when to buy or sell an asset.
💥For example, if an uptrend continuation pattern is identified, traders may consider buying the asset as it is likely to continue its upward trend. Conversely, if a downtrend continuation pattern is identified, traders may consider selling the asset or shorting it as it is likely to continue its downward trend.
💥It's worth noting that not all continuous patterns are reliable and some may result in false signals. Therefore, it's important to use other technical indicators and analysis to confirm the trend before making a trade based on a continuous pattern.
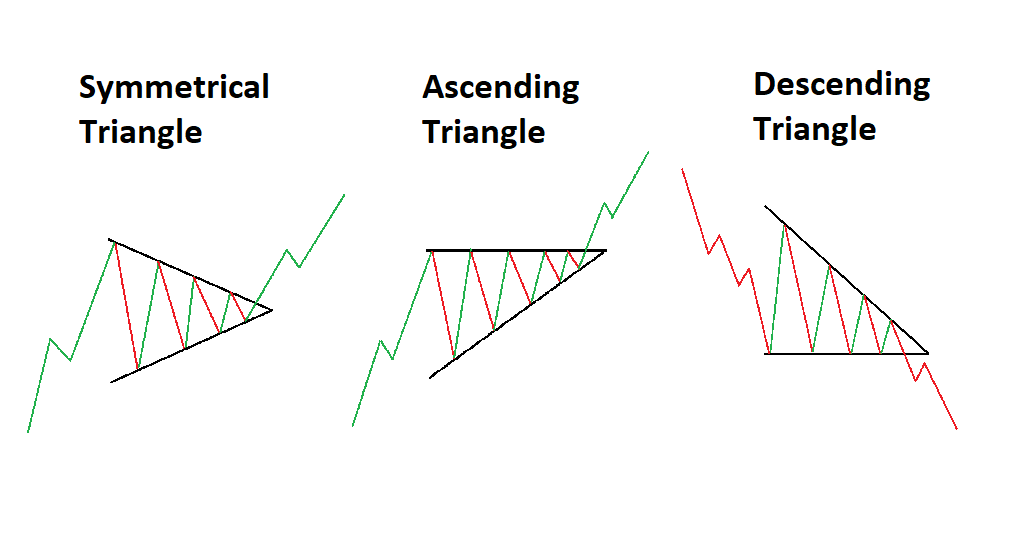
💥Continuous patterns can be considered as a break in the trend, where the price moves in a different direction before continuing in the same trend. This can be an opportunity to analyze the market sentiment and determine if the old trend will continue. There are various types of continuous patterns, including triangle patterns such as symmetry, ascending, and descending, as well as flags and pennants.
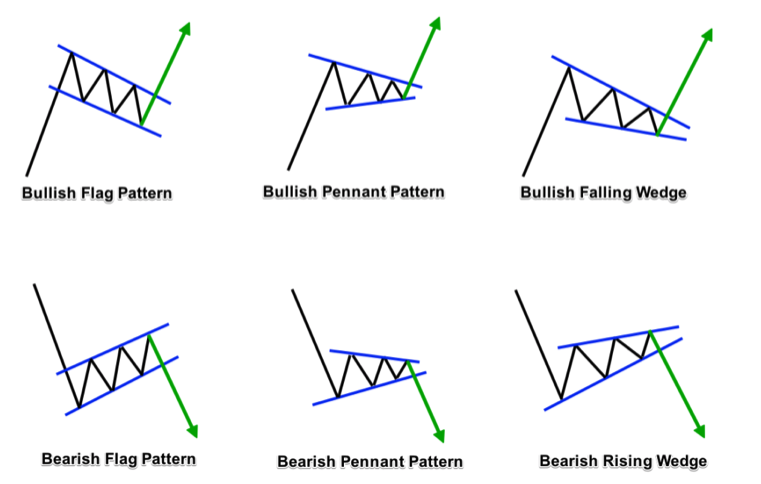
💥Flags and pennants are named after their shapes, with flags resembling a square flag and pennants looking like a triangular flag. These patterns can indicate a pause in the market before the trend resumes, and traders often use them to identify potential buying or selling opportunities. Overall, continuous patterns are important in technical analysis as they can help traders anticipate price movements and make more informed trading decisions.
Comments (0)
Login or Create account, Log in or register to leave a comment
No comments yet. Be the first!