

 English
 Русский
 中文
中文
 Español
 Português
 日本語
日本語

Hi everyone. I have been experiencing your platform a lot lately and noticed if a share didn't have enough liquidity there were some price gaps in range candles which negatively affect drawing them. Take a look a the picture
Chart Range(4)
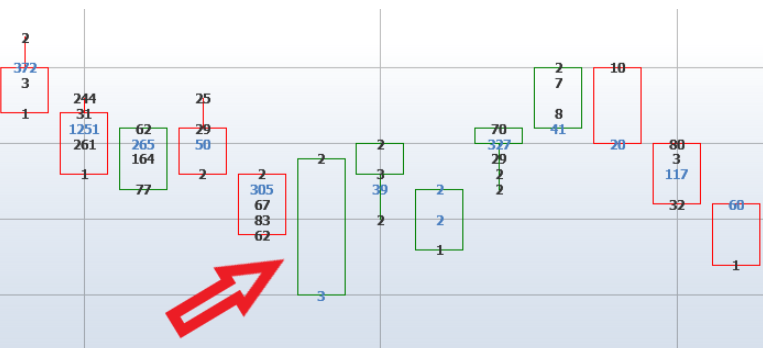
Green candle should have had 5 price levels but we see more What is the best solution to avoid such problem if I use that kind of a chart Thank you in advance
Kommentare (0)
Anmelden oder Konto erstellen, Melden Sie sich an oder registrieren Sie sich, um einen Kommentar zu hinterlassen
Noch keine Kommentare. Seien Sie der Erste!