- In addition to price and volume indicators, there are some indicators in technical analysis that can be used to display general market conditions. To make this possible, traders usually prefer to use indices.
- Exchanges usually provide their own built-in indices such as S&P or DAX. But what to do when you need to use your own calculation only with the instruments of interest to us? Or use some market (for example, cryptocurrencies) where there are no ready-made indices.
- In the StockSharp platform, we can create any kind of index from downloaded market data using our own formula. So we can determine the direction of the market as a whole.
- The index as a method will allow us to determine the direction of movement of this for all the instruments that are included in it. For example, let's say we want to create an index that compares Apple and Amazon.
- When we create an index in S# (by using S#.Data index builder), we can see the direction of the trend from the data of the index on the chart. It will show that during this period, Apple is stronger than Amazon if the chart goes up. But if the chart shows a downtrend, then it means that Apple is weaker than Amazon. If the chart shows a flat, it means that both instruments are equivalent at a distance
- Below we will look at the step-by-step process of how to build index using a simple example, as well as using mathematical functions that allow you to calculate complex trading index.
🤖
Let's see how to find Index from all 3 companies: Apple, Amazon and Google.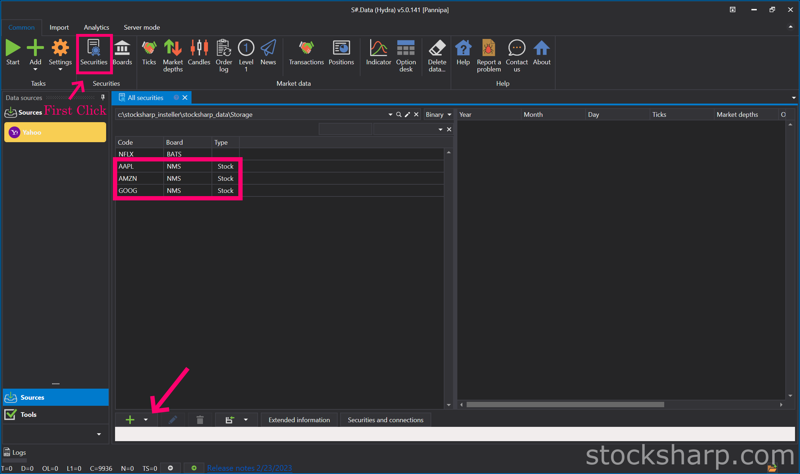
👉 After we downloaded Market Data of Instruments that we need to create the index in to
Hydra already.
👉 For example I downloaded Apple, Amazon and Google for creating index.
👉 Click on the
Securities icon.
👉 On this page will show all Instruments we already downloaded Market Data.
👉 Including the Instruments we want to create
INDEX are Apple, Amazon and Google.
👉 Click on
Plus sign below.
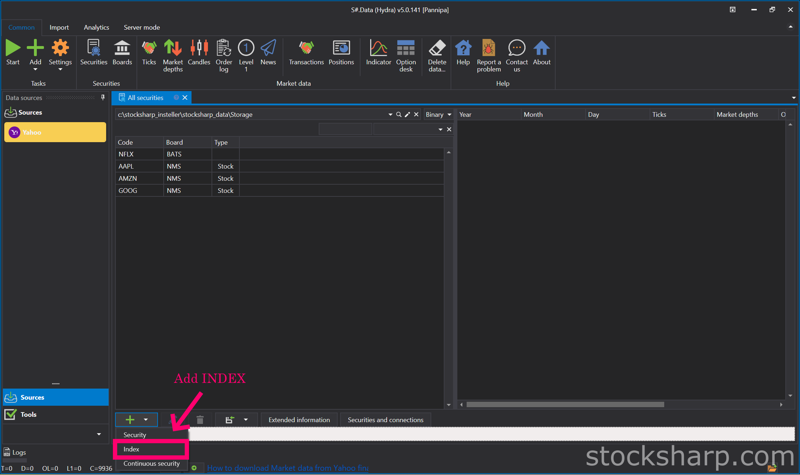
👉 Select
add INDEX.
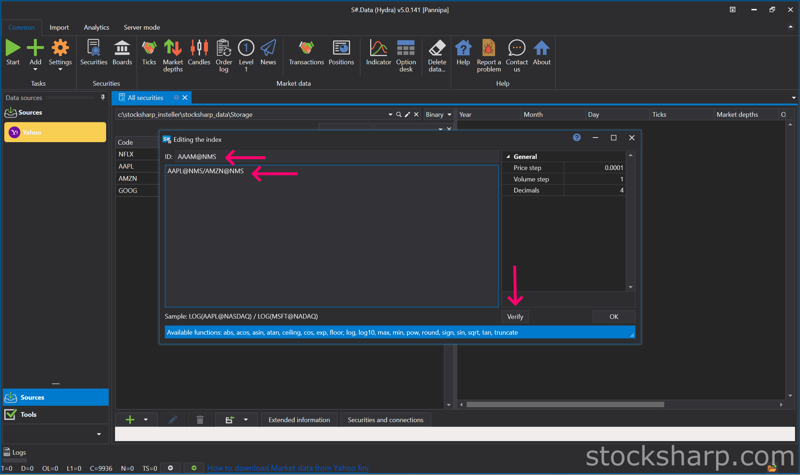
👉 Create the name of the INDEX and put it on the
ID tab.
👉 Put the formula as an example
AAPL@NMS/AMZN@NMS.
👉 From that formula is an Apple device from Amazon.
👉 And then Click
verify formula.
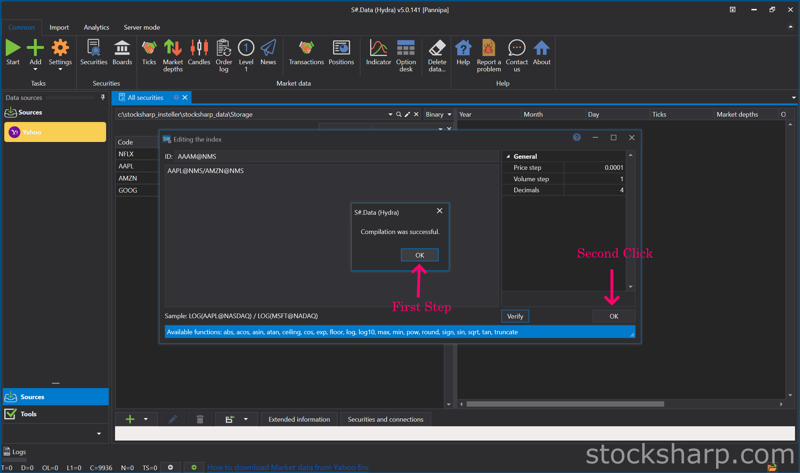
👉 Click
OK, and
OK again.
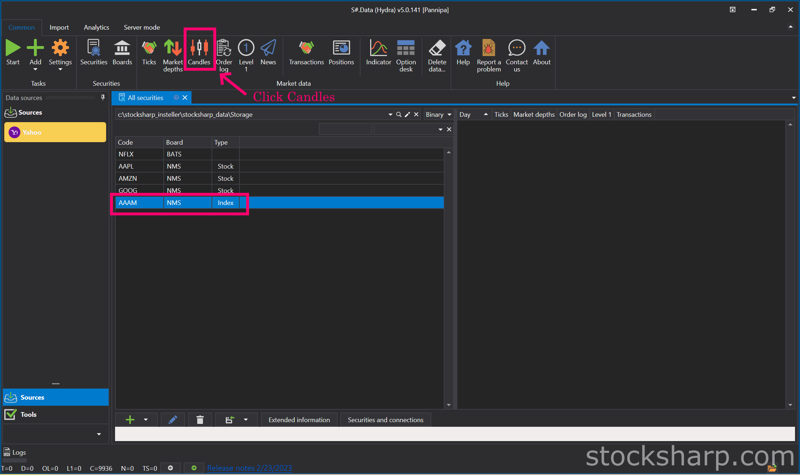
👉 The INDEX we just created will show in all the Instruments Market Data downloaded but that INDEX still does not have Market Data because it is just an INDEX.
👉 Click on the
Candle icon on the top.
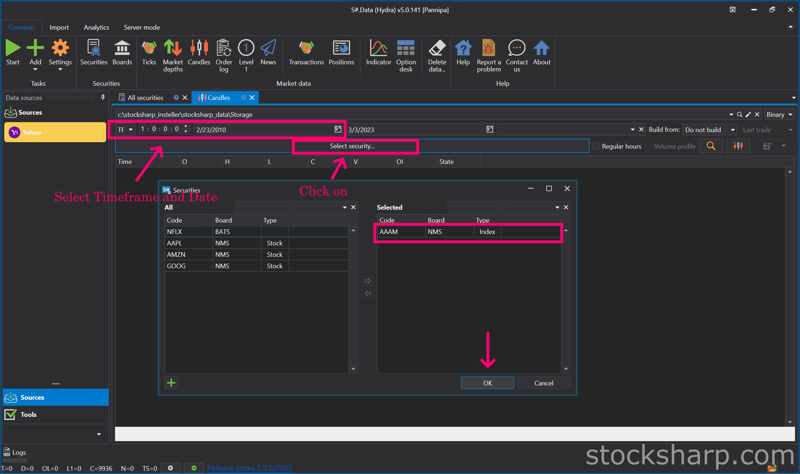
👉 Select
Timeframe and Date.
👉 And then Click on the
Securities tab.
👉 Select
INDEX on the left side by
Double Click.
👉 The
INDEX Instruments will move to the right side.
👉 Click
OK.
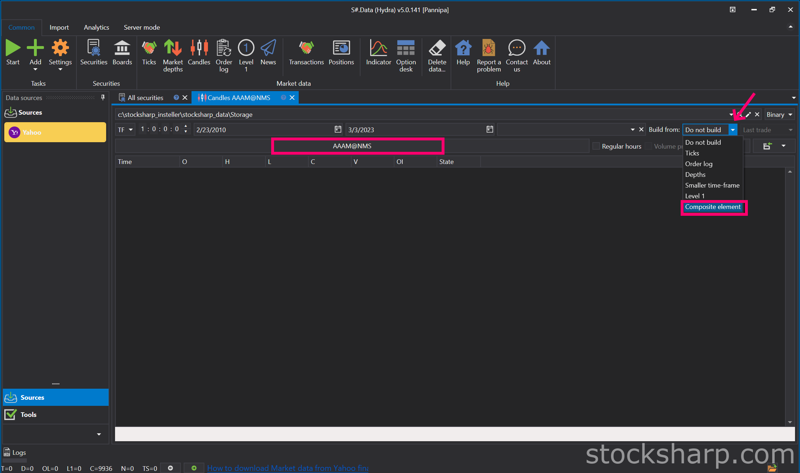
👉 On the Securities tab will change to
INDEX we Selected.
👉 On the
Build from tab Select
Composite elements.
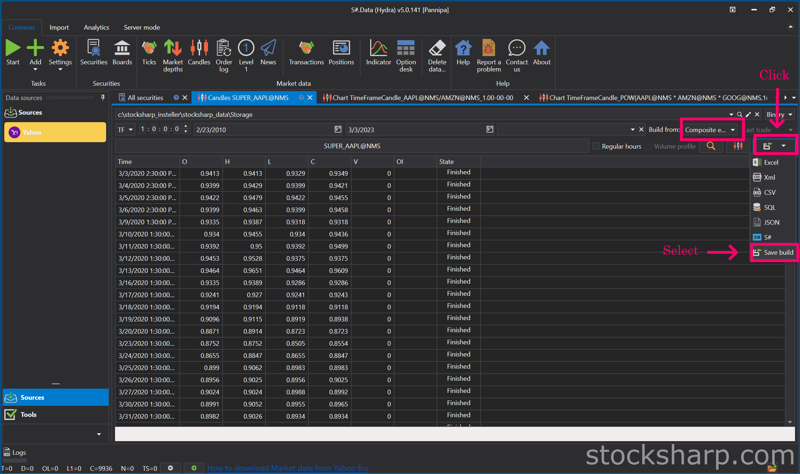
👉 Tip for that : We no need to Select Build from
composite elements every time.
👉 We can
Click save and Select
save build.
- We can save our collation of these Index data without having to recalculate each time. It saves us even more time. When we save the data that we have already calculated The information will be displayed on the Market Data page, which is the real information.
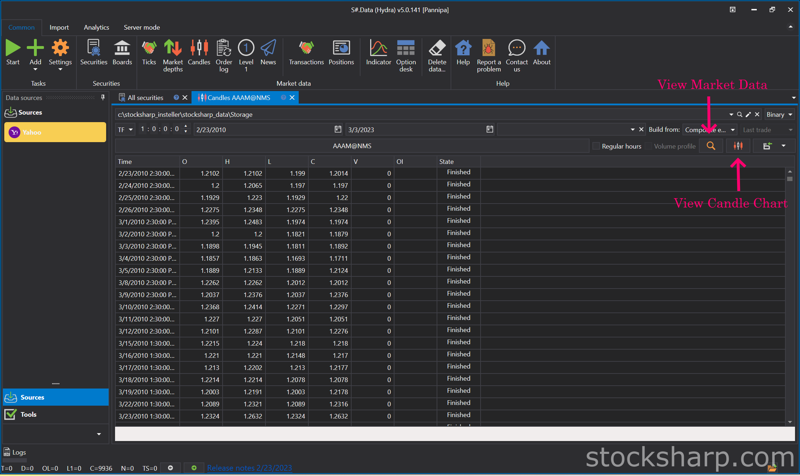
👉 Click
View Market Data Information.
👉 Click
View Candle Chart.
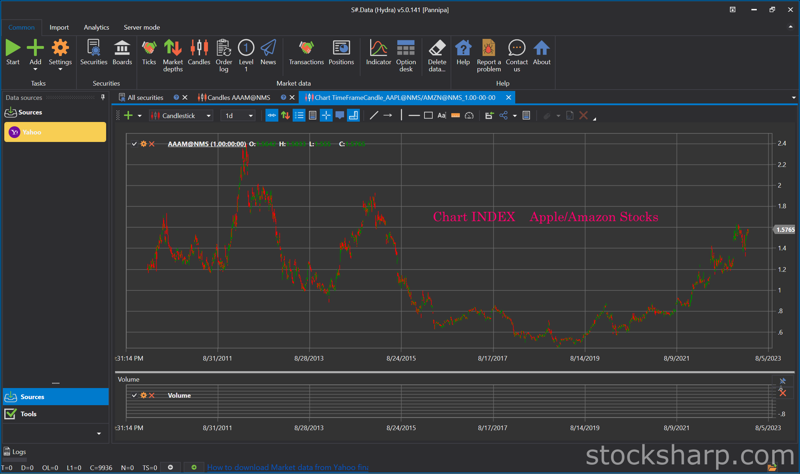
👉 This is the Candle Chart INDEX from
Apple Vs Amazon by Timeframe we downloaded.
👉 We will do the same way to create
another INDEX.
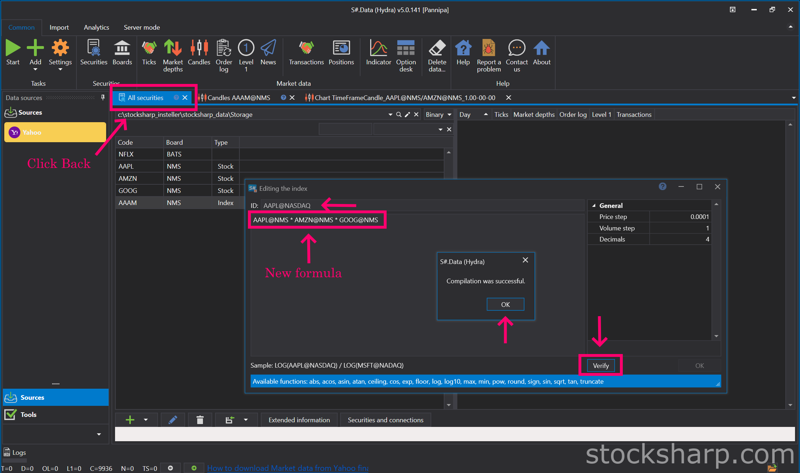
👉 Click Back to All
Securities.
👉 Create the new name of the
INDEX and put it on the
ID tab.
👉 Put the new formula. Other an example
AAPL@NMS * AMZN@NMS * GOOG@NMS👉 And then Click
verify formula.
👉 Click
OK.
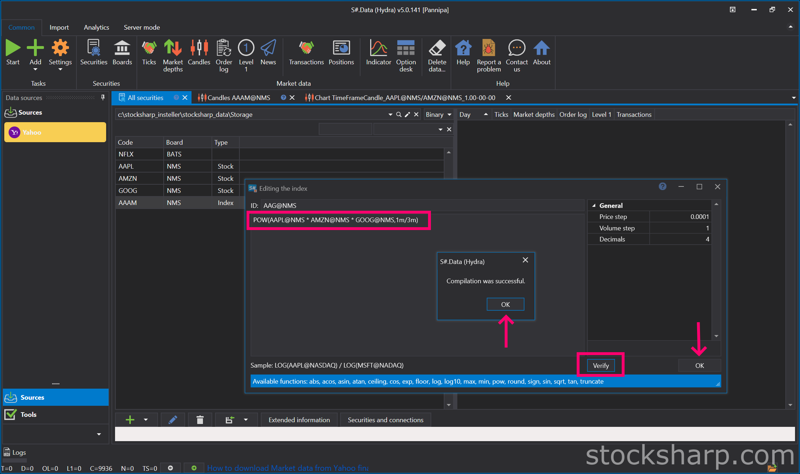
- For example, finding an index using a simple equation Multiply all 3 instruments together. For function to find index in Hydra, put POW(AAPL@NMS * AMZN@NMS * GOOG@NMS,1m/3m) which comes from the word Power in front.. If we Omitting m Hydra understands that it is an integer, not a fraction. So we have to insert m every time so Hydra understands it's a fraction and not an integer.
👉 And then Click
verify formula.
👉 Click
OK. And
OK again.
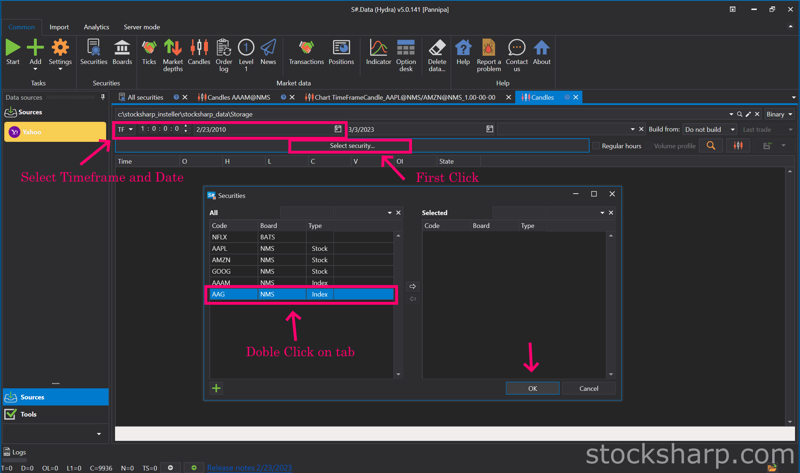
👉 Select
Timeframe and Date.
👉 And then Click on the
Securities tab.
👉 Select
INDEX on the left side by
Double Click.
👉 The
INDEX Instruments will move to the right side.
👉 Click
OK.
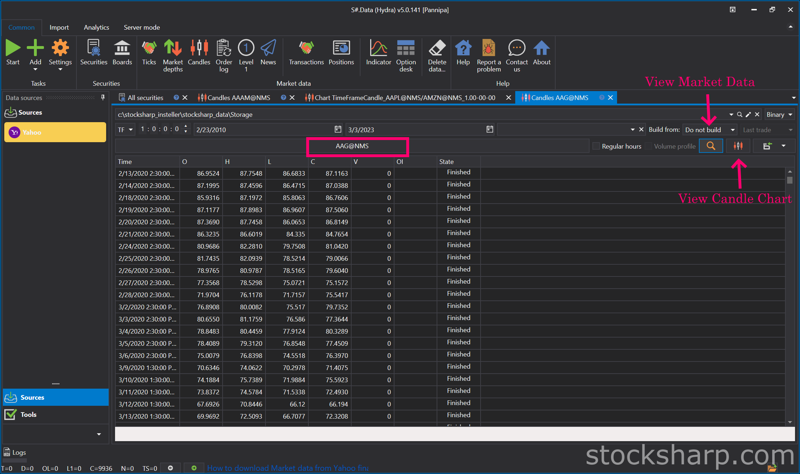
👉 On the Securities tab will change to
INDEX we Selected.
👉 On the
Build from tab Select
Composite elements.
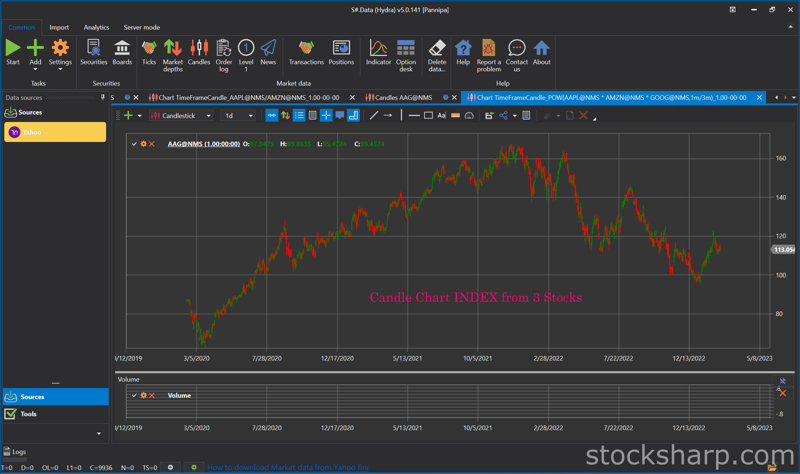
👉 This is the Candle Chart INDEX from
POW(AAPL@NMS * AMZN@NMS * GOOG@NMS,1m/3m) by Timeframe we downloaded.
- Now we can create an index of all 3 instruments in the interval we choose. You can see that the chart shows the trend direction in the market for all 3 instruments. It was only going up for a while and then something happened that caused the chart to go down significantly. At the time when the chart changes direction, we can look back at the news, events, and changes about the 3 instruments from the past at that time. And quite different from the Chart Index from Apple and Amazon, which is in the direction of only an upward trend.
- When we find the index of all 3 instruments that we have calculated. And we want to compare that from the index of these 3 Instruments, what kind of trend will Apple stocks be in the market? Now we just compare the Instruments Apple with the index of the 3 instruments that we have already calculated. and see in which direction the chart will be displayed.
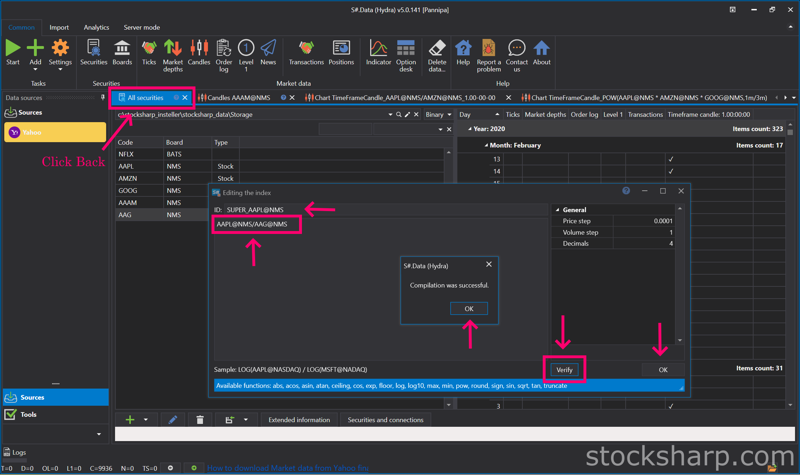
👉 Create the name of the
INDEX and put it on the
ID tab.
👉 Put the formula as an example
AAPL@NMS/AAG@NMS.
👉 From that formula is an
Apple divide from INDEX of 3 Instruments.
👉 And then Click
verify formula.
👉 Click
OK, and
OK again.
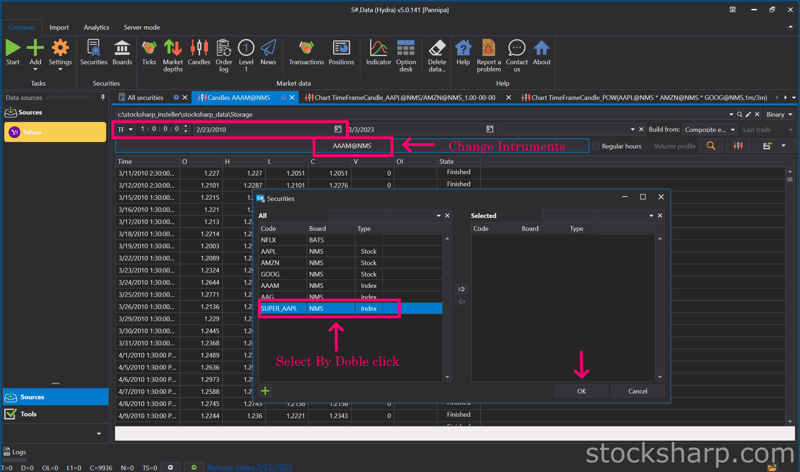
👉 Select
Timeframe and Date.
👉 Click Change
Instrument.
👉 Select
INDEX instrument by
Double Click on Instrument tab.
👉 Click
OK.
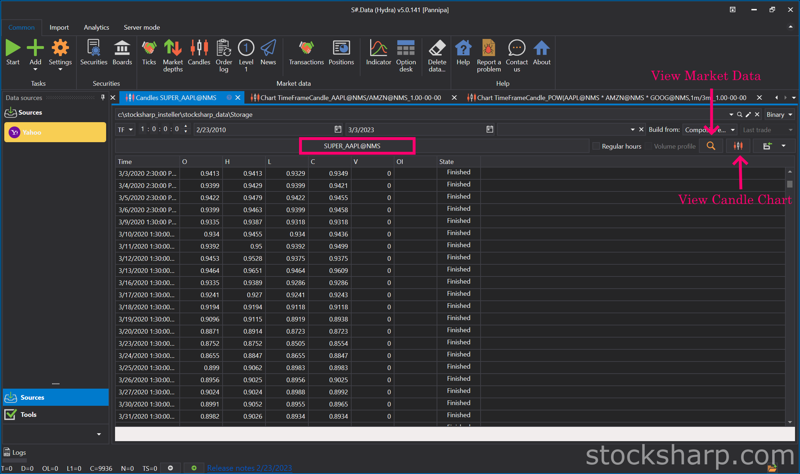
👉 Click
View Market Data Information.
👉 Click
View Candle Chart.
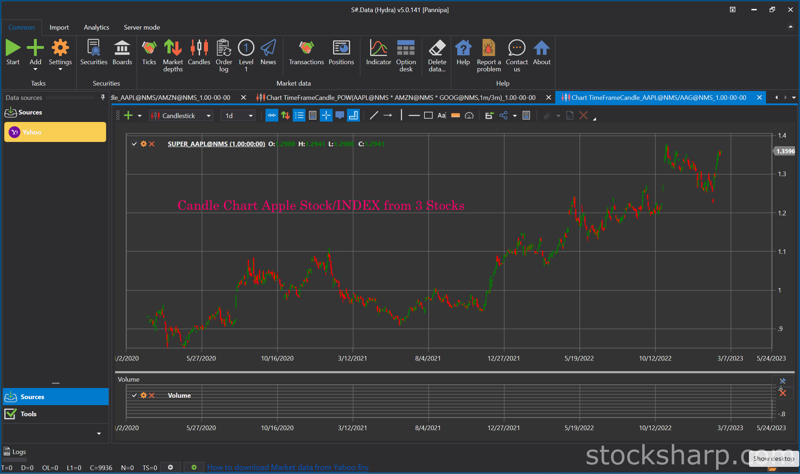
👉This is the Candle Chart INDEX from
Apple divided from INDEX of 3 Instruments by Timeframe we downloaded.
- From the chart we can see that it is an uptrend. This shows us that Apple is stronger than the whole IT sector.
- You can use indexes in your own trading or analysis (e.g., by exporting calculated data into other programs).
- Hope this blog is interesting for you. Please comment us what you interesting to know more about S#.Data. We will try to write our next posts.