
 Русский
 中文
中文
 Español
 Deutsch
 Português
 日本語
日本語
💥V-shape is a chart pattern that signals a potential reversal in the trend of an asset. As the name suggests, the pattern looks like the letter "V".
💥The V-shape pattern occurs when an asset's price experiences a rapid decline, followed by a sharp recovery. This creates a V-shaped pattern on the price chart. The pattern is significant because it suggests that the asset's price has reached a low point and is now likely to reverse its trend and move upwards.
💥The key to identifying a V-shape pattern is to look for a sharp drop in price, followed by a sudden rebound. The rebound should be strong enough to push the price back up to at least the halfway point of the decline.
💥Traders often look for V-shape patterns as they can provide a good opportunity to enter a trade at a low price and ride the upward trend. However, it is important to note that not all V-shape patterns will result in a reversal, and it is always wise to use other indicators and analysis to confirm the trend before making a trade.
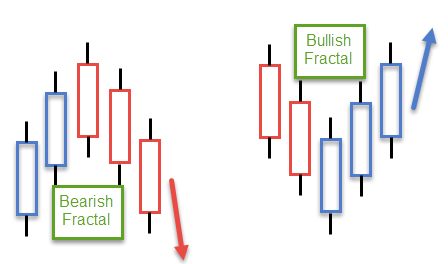
💥There are two types of V-shape reversals: the top V and the bottom V. Let's start with the bottom V. The key is to point out that there will be a V-shape pattern at the bottom of the chart at the very bottom. What does that bar graph tell us? It tells us that on that day, the price was smashed down to close near the lowest price level, which reflects high sales demand. For the next day, at the opening of the market, the male force that remained the day before burst out again, resulting in the price quickly falling to a new low, as seen from the lowest price in the next bar, which is lower than the previous bar. After that, the demand for buyback began to come in and pursued a big buyback until the closing price in the next bar was above the closing price in the previous bar. This means that buying pressure can overcome selling momentum in the last curve. Therefore, bars 1 and 2 are key indicators of a quick transition from a downtrend to an uptrend, similar to the V.
💥As for the top V in the figure, there is a key located at the bar graph before the highest top and the highest top. It can be seen that the highest price in the bar graph of the top is higher than the previous bar, but its closing closed at a lower level than the previous bar's close. This is a signal that indicates a sharp shift from an uptrend to a downtrend.
Comments (0)
Login or Create account, Log in or register to leave a comment
No comments yet. Be the first!