| 0 |
| Votes |
|
| 0 |
| Answers |
|
| 1094 |
| Views |
|
[center]   [img=135956]b09223ca-7e94-42ac-b1e7-a769735a6b19.png[/...
|

12/4/2022
To last
|
|
| 0 |
| Votes |
|
| 0 |
| Answers |
|
| 935 |
| Views |
|
💥A runaway gap, also known as a measuring gap or continuation gap, is a type of gap that occurs in the middle of a trend. It is usually seen as ...
|

11/26/2022
To last
|
|
| 0 |
| Votes |
|
| 0 |
| Answers |
|
| 3345 |
| Views |
|
💥An ascending triangle is a type of pattern that can be found in technical analysis. It is formed when the price of an asset moves within a converging range, with a horizontal resistance line at the ...
|

11/14/2022
To last
|
|
| 0 |
| Votes |
|
| 0 |
| Answers |
|
| 938 |
| Views |
|
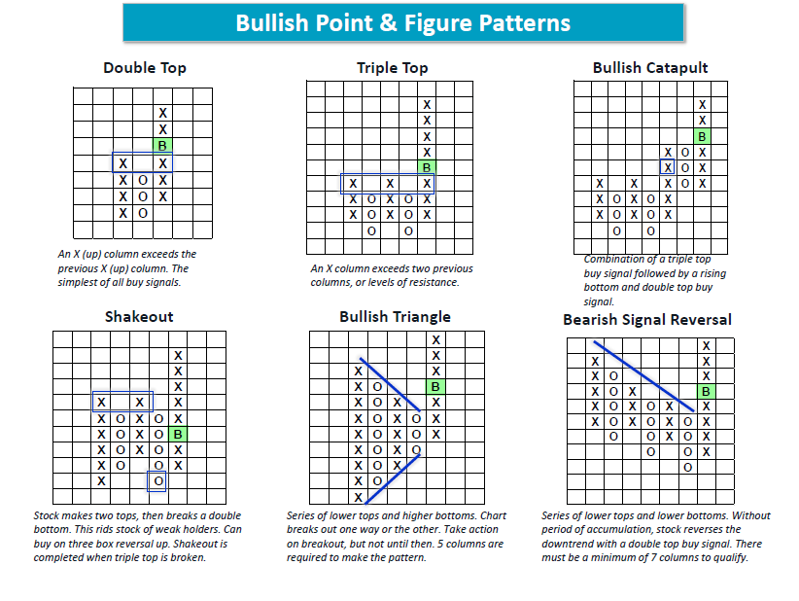
💥A double top is a technical chart pattern that occurs when the price of an asset reaches a high point, experiences a temporary decline, and ...
|

11/8/2022
To last
|
|
| 0 |
| Votes |
|
| 0 |
| Answers |
|
| 1091 |
| Views |
|
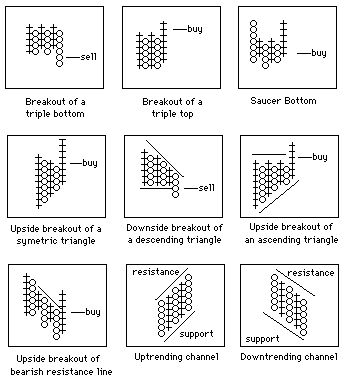
💥Triple Tops and Triple Bottoms are reversal patterns that appear on price charts. They occur when the price of an asset creates three consecutive peaks or troughs at approximately the same level. Tr...
|

11/7/2022
To last
|
|
| 0 |
| Votes |
|
| 0 |
| Answers |
|
| 1082 |
| Views |
|
💥Support and resistance are two important concepts in trading that help traders identify potential price levels where an asset may experience buying or selling pressure.
💥Support refers to a pric...
|

11/5/2022
To last
|