💥Triple Tops and Triple Bottoms are reversal patterns that appear on price charts. They occur when the price of an asset creates three consecutive peaks or troughs at approximately the same level. Triple tops occur during an uptrend, indicating a possible trend reversal, while triple bottoms occur during a downtrend, signaling a potential shift in trend direction.
💥In a triple top pattern, the first peak represents a resistance level that the price is unable to break through, causing it to decline to a support level. The second peak shows a renewed attempt to break through the resistance level but is again rejected, leading to another decline to the support level. Finally, the third peak fails to surpass the resistance level, and the price declines below the support level, signaling a potential downtrend.
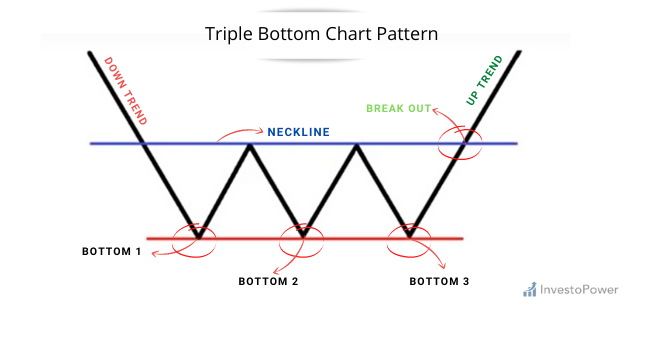
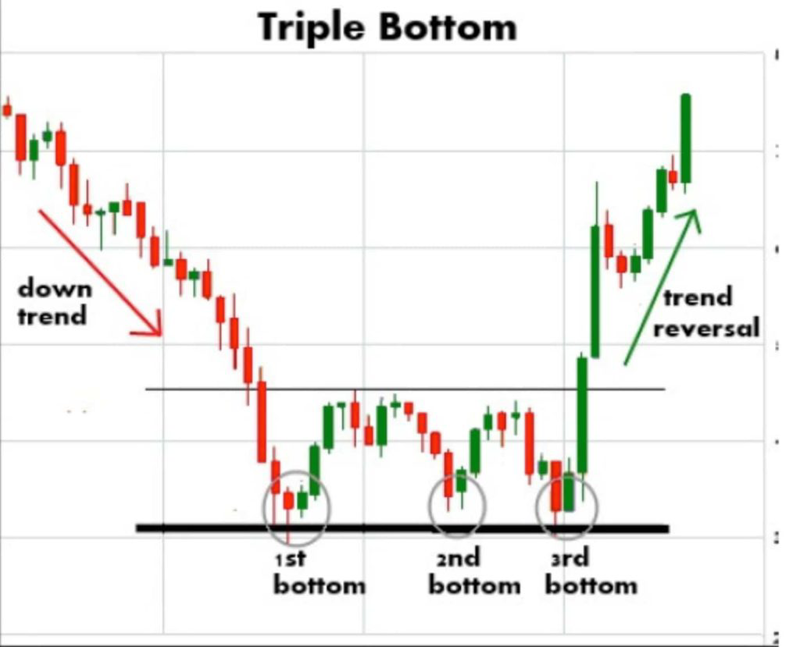
💥In a triple bottom pattern, the first trough represents a support level that the price cannot break through, causing it to rise to a resistance level. The second trough shows a renewed attempt to break through the support level, but it is again rejected, leading to another rise to the resistance level. Finally, the third trough surpasses the support level, and the price rises above the resistance level, signaling a potential uptrend.
💥Traders usually confirm the pattern by looking at the trading volumes during each peak or trough. Higher trading volumes at the peaks and troughs indicate stronger support and resistance levels. The neckline, which connects the peaks or troughs, is also essential. A break below the neckline in a triple top pattern or above the neckline in a triple bottom pattern confirms the pattern, and traders may initiate trades based on the anticipated trend reversal.
💥Let's discuss triple tops first. Broadly speaking, it refers to when the volume price tries to break through a horizontal resistance but fails to do so, resulting in a subsequent correction. It may be difficult to understand this concept just by listening to it. Therefore, let's try to delve deeper and look at some visuals.
💥In the figure above, let's say the price is moving up and reaches the top 1. Then, there is a sell-off that causes a decline to the bottom 1. However, the trading volume during the bottom 1 is still not significant because everyone thinks it is a minor correction in a major uptrend. They want to buy, and the price continues to rise until it reaches close to top 1 again. Traders have confidence that it will continue to move in an uptrend, and the trading volume during this period is quite large.

💥As mentioned above regarding the meaning of resistance, the price moved down from the second top and continued to flow down to the second bottom, which is a support line. Traders' expectations remain that there may be a rebound. Therefore, during the second bottom line, the volumes appearing are less than during recent uptrends because there is still a concern that after selling, it cannot be repurchased (bought back at a higher price than it was sold). However, when it comes to actually moving up to the third top, some traders are starting to worry because it has failed to pass through it twice before. Therefore, they do not dare to buy to pursue. The number of volumes in this period is seldom different from the last period, so when it reaches the third top, it is quite brittle. A downward adjustment is likely to occur. It can be seen that the price attempted to break the horizontal resistance three times (triple) but still failed to pass through.
💥The completeness of the form takes place when the price has adjusted down until breaking through the horizontal support line that used to support the abyss point 1 and bottom point 2 down. Here, the level is seen as a neckline, similar to the case of head & shoulders, but in fact, they call it the base line. The amount of volume in this period will increase a lot as a result of the profit that will occur after.
💥The question is, will you stop playing at all? The answer is no! But you will wait to set up at a level away from the neckline down equal to or close to the distance measured from the top 2 to the neckline. In principle, there may be some rebound, but that's just a bounce, not a shift. Continually rising playing in this period could be a bit of play and wait to take profits at the level before or close to the neckline. The number of volumes sold out was enormous. You can see that at the beginning, the volume movement is still an uptrend, but later the trend has become a downtrend, and thus it is one of the reversal patterns.

💥If you still don't understand, I encourage you to study the concept again and again. It's not as difficult as you may think! For those who understand, let's move on to discussing triple bottoms. Firstly, we need to understand what triple bottoms are used for. Can you guess? Some traders may have already figured it out. It is a pattern that increases the likelihood of a downtrend turning into an uptrend.
💥Initially, the price trend was still in a downtrend. When the price hit bottom 1 in the chart, buying pressure pushed the price back up. Buyers saw the price at bottom 1 as cheap. However, when the price reached top 1, some people decided to sell and take profit because the overall trend was still in a downtrend. This selling pressure caused the price to fall back down to the base, as defined by the support line mentioned earlier.
💥The price then rebounded from bottom 2 and continued to rise until it reached peak 2. However, it was hit again and began to fall once more until it reached bottom 3. This time, there should be more buying interest as the price had fallen twice before but did not go lower than the previous two bottoms (bottom 1 and bottom 2). Buyers had to fight to push the price back up.

💥If the price can break through the base line resistance again, it will gain a lot of reinforcement. The number of traded volumes will increase, confirming that this rise is strong enough. Many are starting to see that this is a pattern of triple bottoms, although there may be some downturn from short-term take profit. The distance before the neckline compared to the distance between Bottom 1 and Bottom 2 is an adaptation in preparation for an uptrend in the form of triple tops or triple bottoms. When forming, it can be seen that volume and prices move sideways, as shown in the figure depicting triple tops in real volumes.