To simplify the work with indicators, you can build and save them in
Hydra.
Let's consider the order of construction of the chart of the indicator of exchange trade on the example of the indicator SMA (simple moving average):
1. Run the Hydra program.
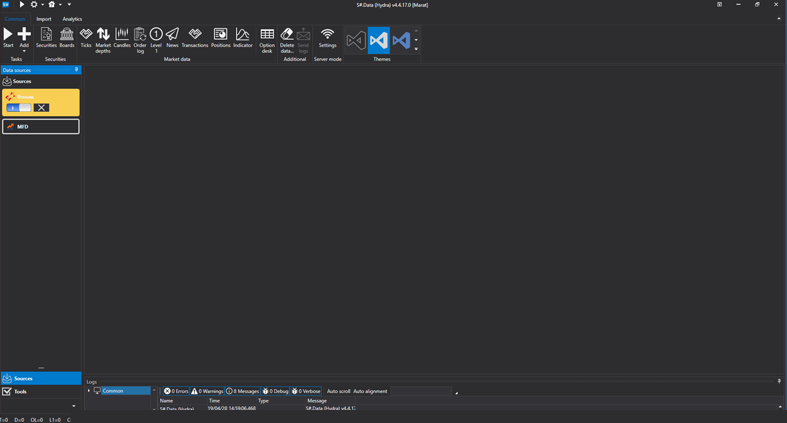
2. Select the stock data source. (1.1)
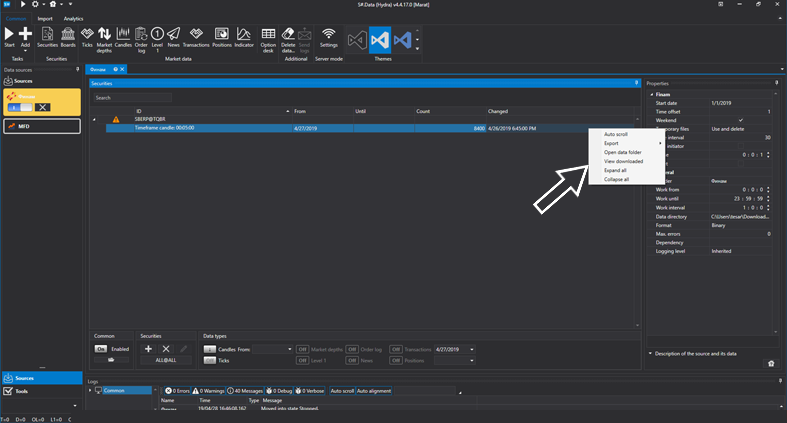
3. Right-click, and in the drop-down list select View Downloaded (1.2)
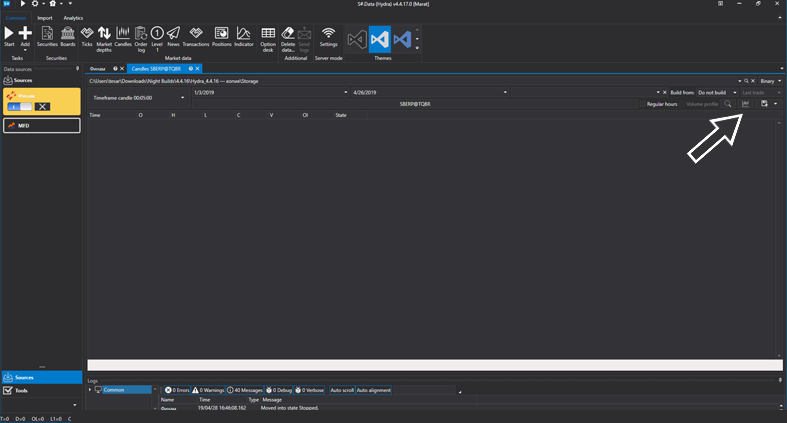
4. Select the “chart” icon and plot the history of stock quotes (1.3) (1.4)
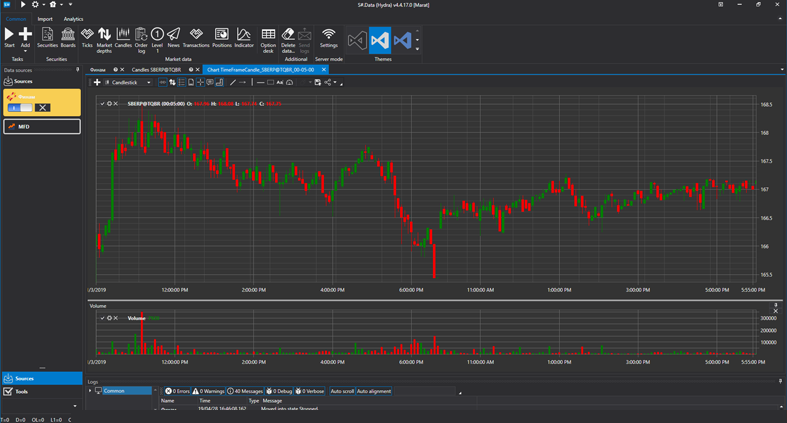
5. Right-click in the chart area and select the Indicator item. (1.5)
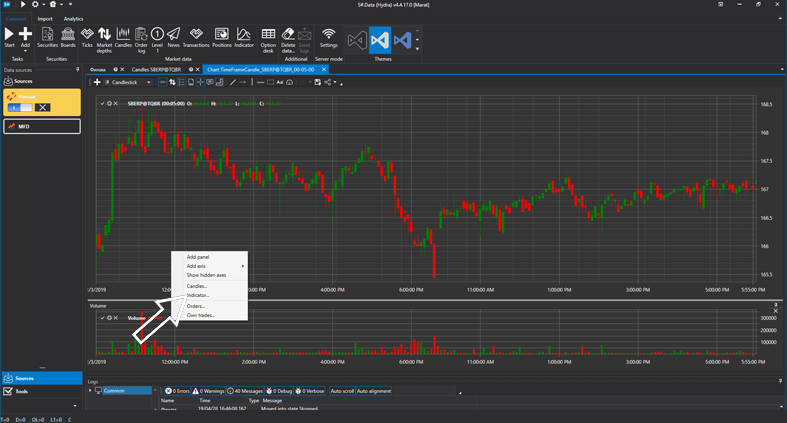
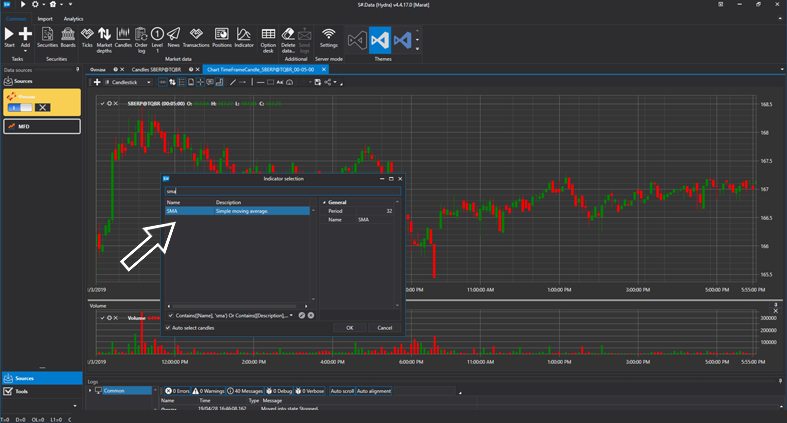
6. From the drop-down list, select the indicator of stock quotes we need, in our case SMA, and click OK. (1.6)
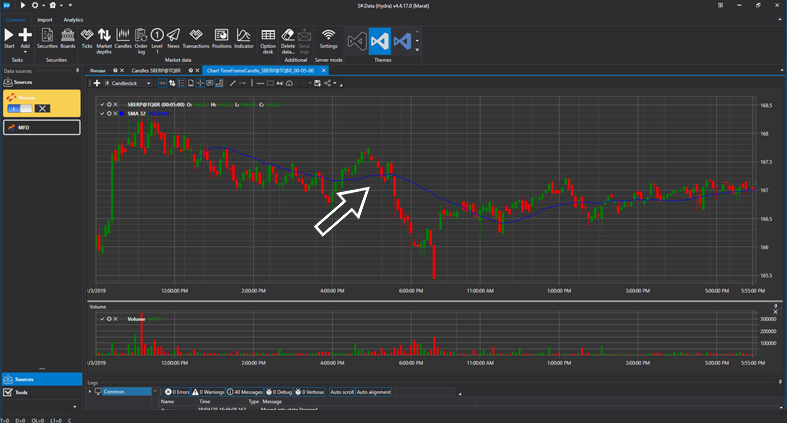
7. On the market data chart, the stock quotes indicator curve will be displayed. (1.7)
8. To plot the SMA indicator chart separately, we need to click the “+” button in the upper part of the stock quotes history chart area, and in the field that opens below click the right mouse button. Select the Indicator item, select the required indicator in the list and click OK. (1.8) (1.9)
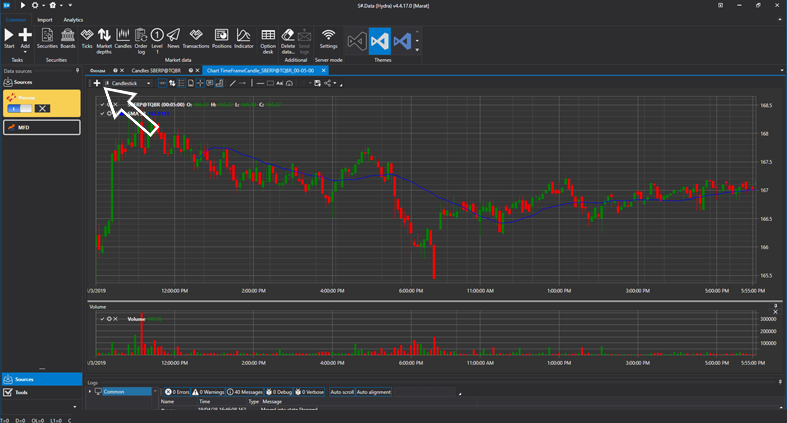
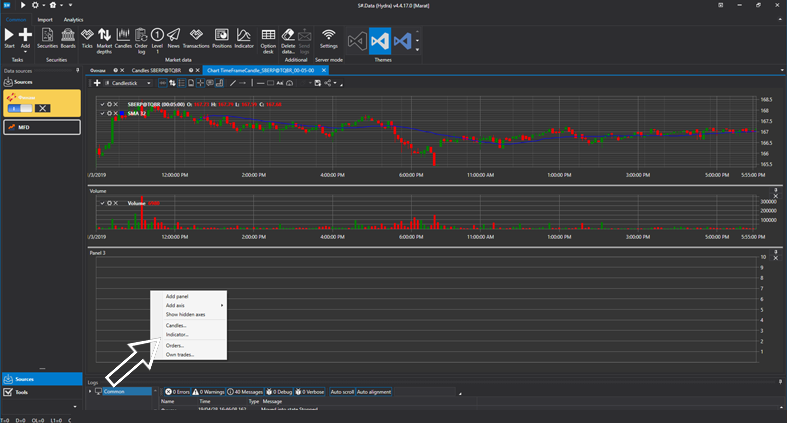
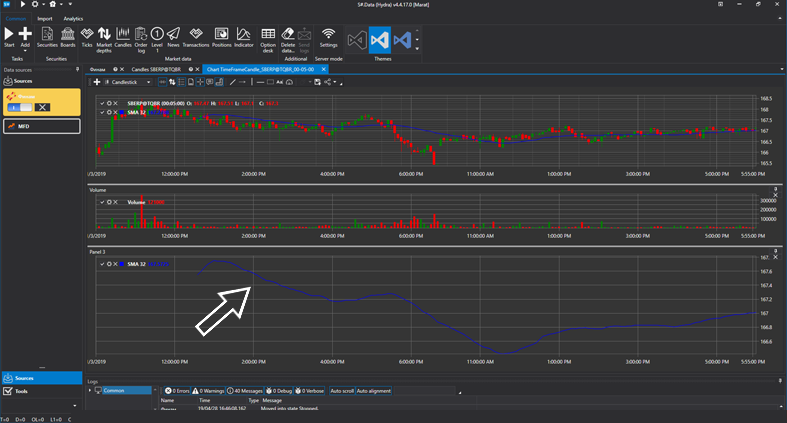
9. The stock quotes indicator chart will be plotted in a separate window. (1.10)
The considered functionality of the Hydra program allows you to apply indicators calculated from the downloaded market data on any platform, which makes it easier to work with trading algorithms.
Enjoy using the program.