Hydra Analytics - Volume Profile
Hello again!In today's episode, we will talk about another script in Hydra Analytics - the volume profile. But first, let's cover the basics.
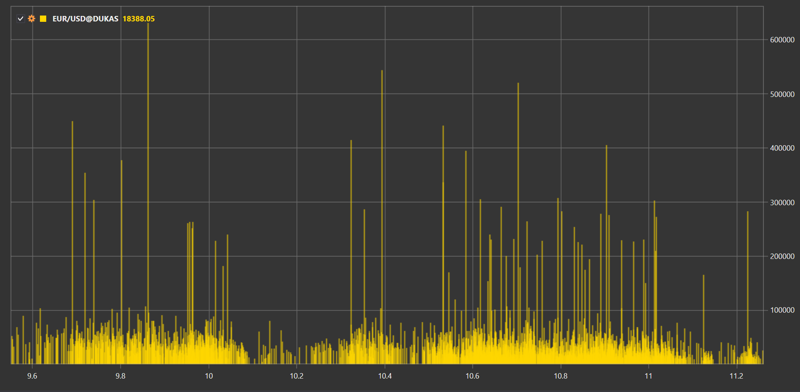
The volume profile in financial charts is a graph that displays the trading volume for each price level in the market over a specific period of time. It allows traders to analyze which prices are traded most actively and which price levels may be key for the market. The volume profile can help in identifying support and resistance levels, as well as in making decisions to buy or sell assets.

- The volume profile in the form of a histogram is a graphical representation of trading volumes at specific price levels. The histogram consists of vertical bars that represent trading volumes at each price level. The higher the bar, the more trading activity occurred at that price level. Thus, the volume profile visually assesses which price levels had more trading activity concentrated and which price levels may be important for identifying support and resistance levels in the market. Additionally, the volume profile can help traders identify potential entry and exit points for positions based on volume levels and changes in trading volumes at different price levels.
- Traders use the volume profile in trading to analyze the market and make trading decisions. They can use the volume profile to determine support and resistance levels and to identify key price levels. Furthermore, the volume profile can help traders understand which prices are traded most actively and which price levels may be crucial for the market. This allows traders to make more informed decisions to buy or sell assets based on trading volume and other factors influencing the market.
- In quantitative analytics, the volume profile can be used to create price forecasting models and assess risks. Analyzing the volume profile can help identify hidden patterns and trends in the market that can be used to create more accurate forecasting models. Additionally, the volume profile can be used to assess the probability of a specific price level being reached in the future, enabling traders to make more informed decisions about buying or selling assets. Overall, volume profile analysis is an important tool for quantitative analysts looking to create more accurate forecasting and risk management models in financial markets.
- The volume profile can be used in trading robots to make automated decisions to buy or sell assets based on trading volumes. A trading robot can use the volume profile to determine support and resistance levels in the market, as well as to identify potential entry and exit points for positions. Additionally, the volume profile can help the trading robot assess the probability of a specific price level being reached in the future and make appropriate decisions to buy or sell assets. Overall, using the volume profile in trading robots can help improve the quality of decisions made and increase trading efficiency in financial markets.
We hope our latest script will be very useful for you. Download our Hydra and use it for free today.