What about Gaps Patterns?
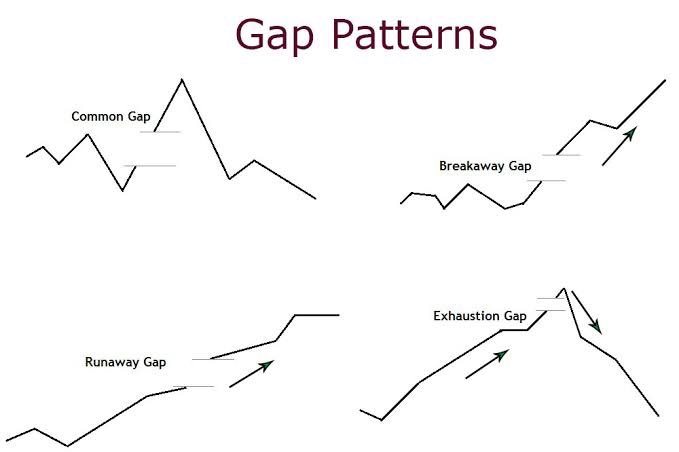
💥Gaps are a common phenomenon in financial markets that can indicate significant price movements. A gap occurs when there is a difference between the closing price of a trading day and the opening pr...
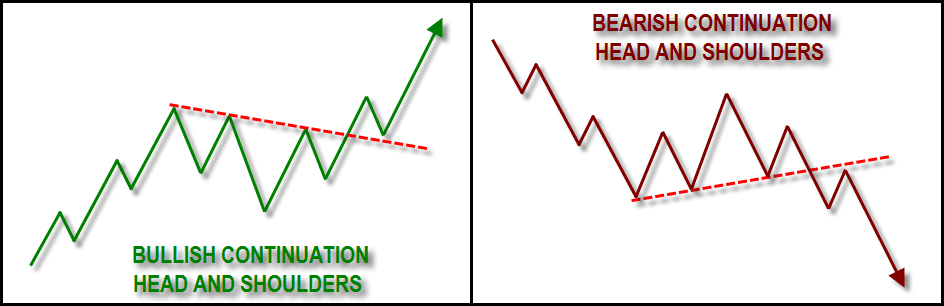
💥The inverted head and shoulders pattern is a chart pattern that signals a potential reversal of a downtrend. It is formed by three lows, with the middle low (the head) being lower than the other two...
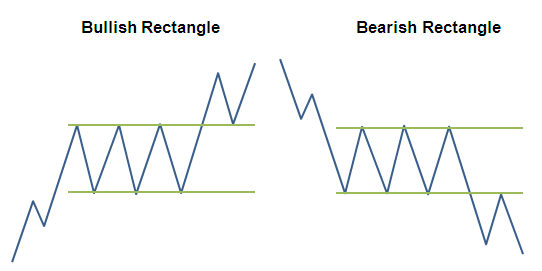
💥A rectangle is a chart pattern that signals a period of consolidation in the price movement of an asset. The pattern is formed when the price moves between parallel support and resistance levels, cr...
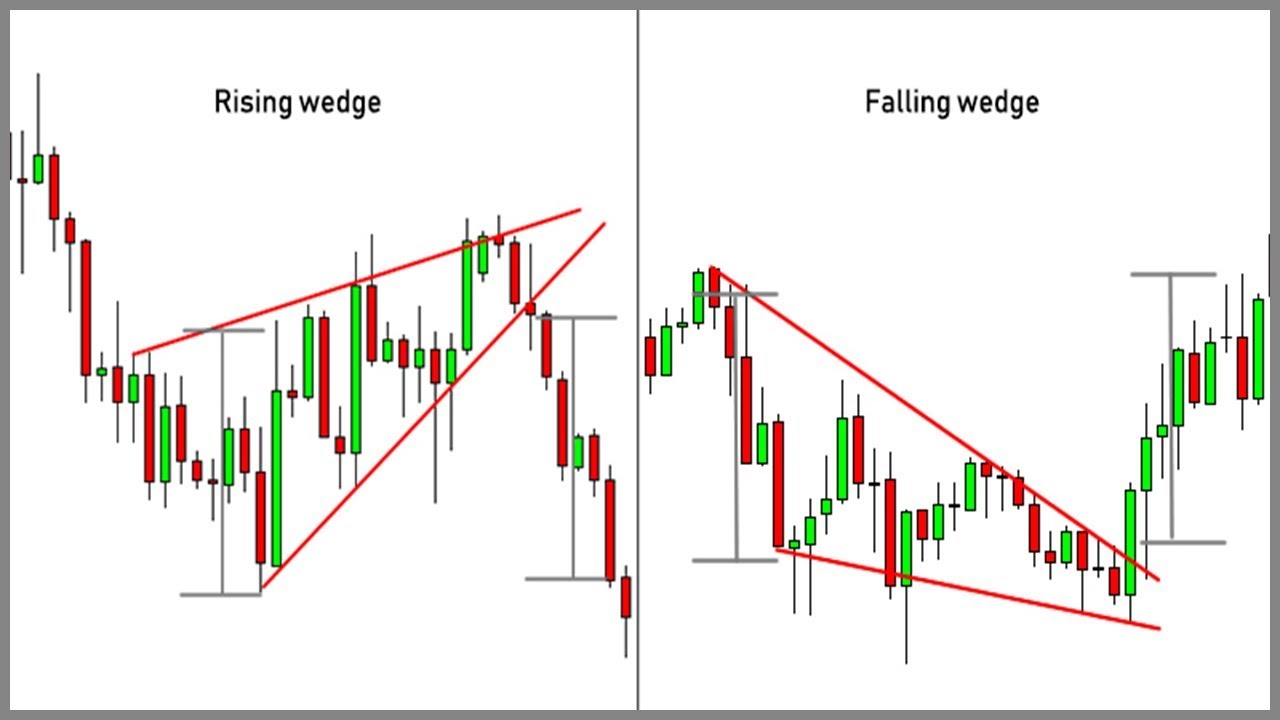
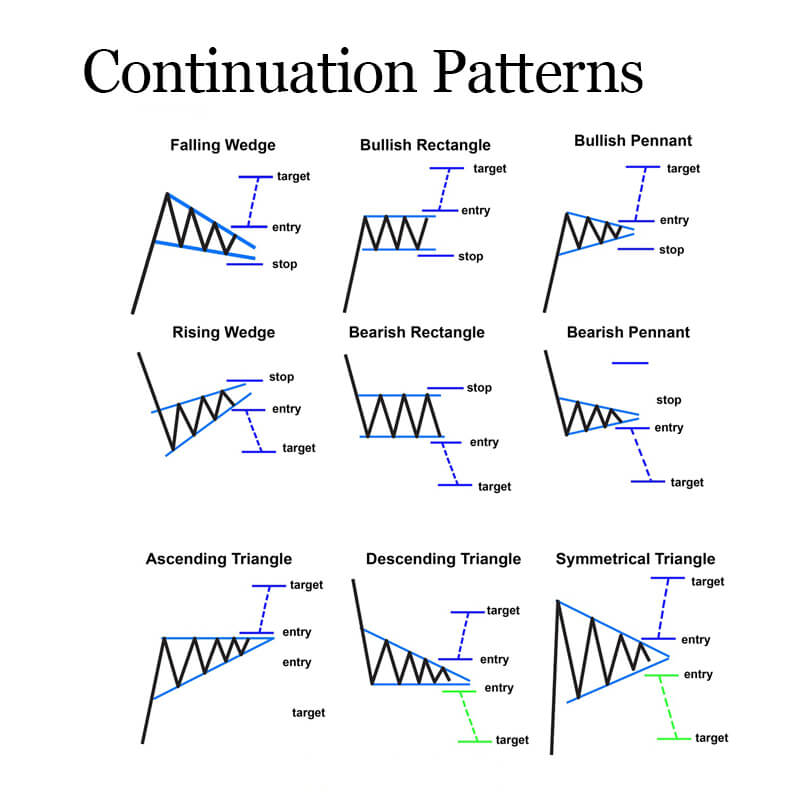
💥A wedge is a chart pattern that signals a potential trend reversal or continuation. It can be either a rising wedge or a falling wedge. 💥A rising wedge is formed when the price consolidates between...
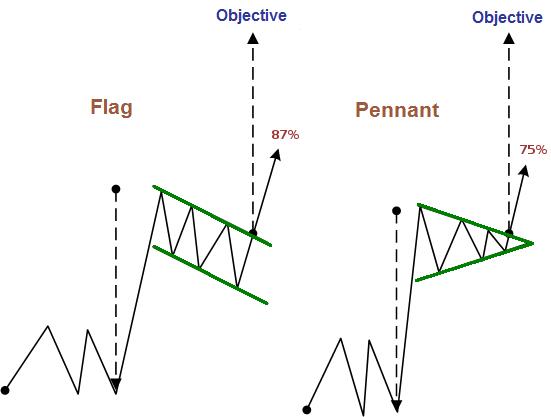
💥Flags and Pennants are two chart patterns that can occur during a trend, typically after a significant price movement. They are classified as continuation patterns as they suggest that the previous ...
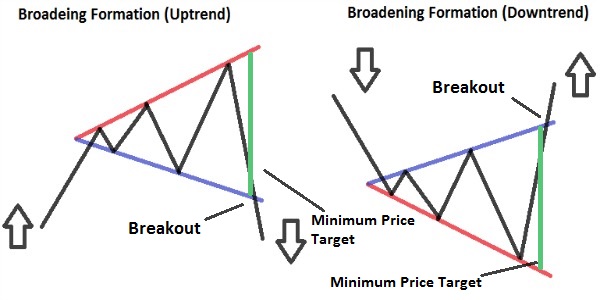
💥Broadening formation, also known as megaphone or expanding triangle, is a chart pattern characterized by two trend lines that are diverging from each other. The top trend line represents the resista...
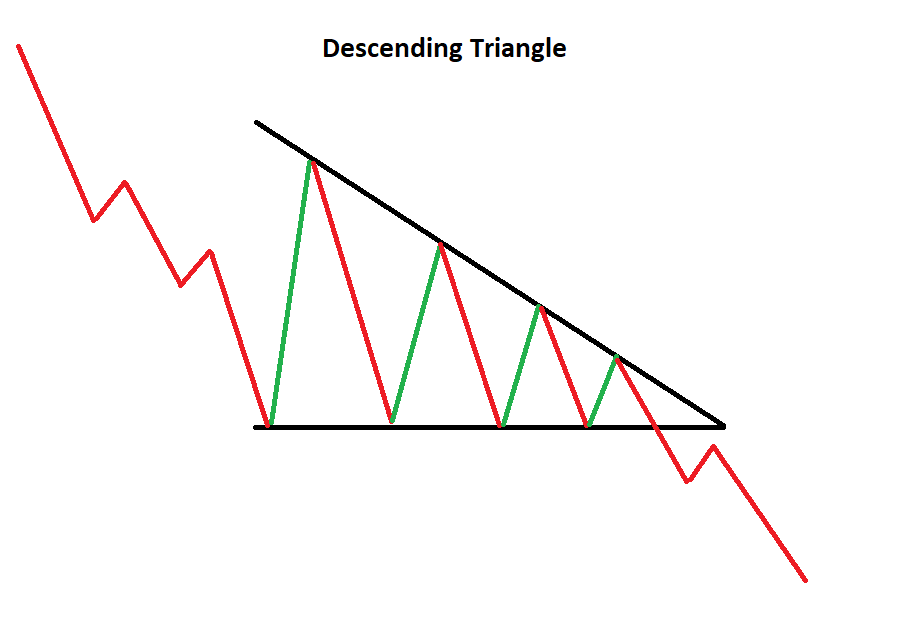
💥A descending triangle is a chart pattern in technical analysis that is formed when the price of an asset moves within a converging range, with a downward-sloping trend line at the top and a horizont...
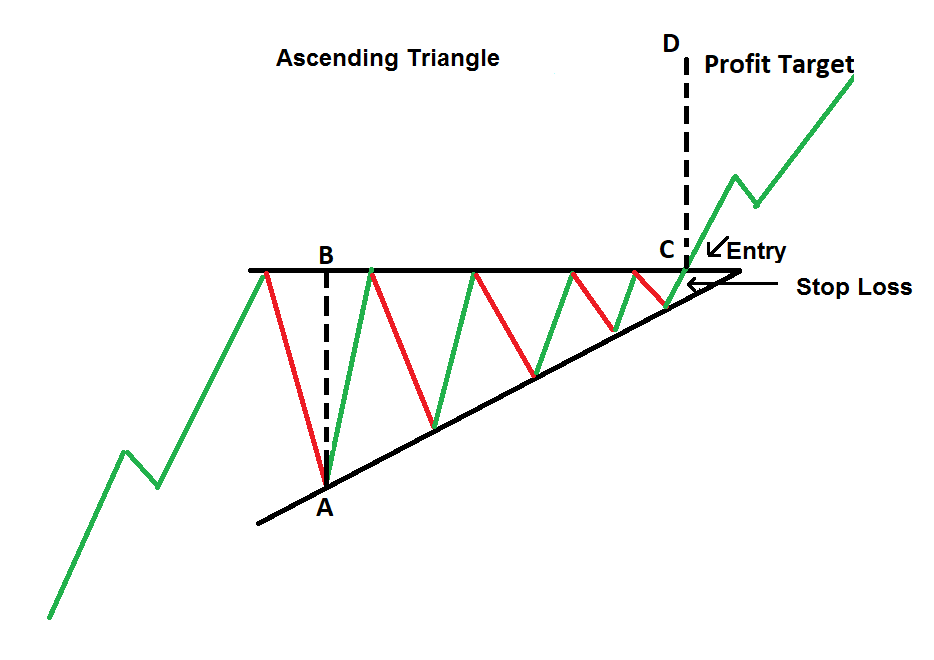
💥An ascending triangle is a type of pattern that can be found in technical analysis. It is formed when the price of an asset moves within a converging range, with a horizontal resistance line at the ...
💥A symmetric triangle is a type of continuous pattern in technical analysis that occurs when the price of an asset moves within a converging range, forming two trend lines that meet at a point. This ...
💥Continuous patterns are chart patterns that indicate that the price of an asset is likely to continue moving in the same direction as the current trend. These patterns are characterized by a series ...
{{entity:product:83}} (v5.0.21): remove extra references from projects Ecng.Roslyn -> Ecng.Compilation.Roslyn {{entity:product:11}} (v5.0.22): remove extra refs from csproj remove extra references fro...
{{entity:product:5}} (v5.0.107): IBoardMessageProvider, ISecurityMessageProvider. BoardCodes
{{entity:product:80}} (v5.0.125): Connectors depends from Messages ref only. {{entity:product:75}} (v5.0.128): Connectors depends from Messages ref only. {{entity:product:1082}} (v5.0.120): Connectors...
💥V-shape is a chart pattern that signals a potential reversal in the trend of an asset. As the name suggests, the pattern looks like the letter "V". 💥The V-shape pattern occurs when an asset's price...
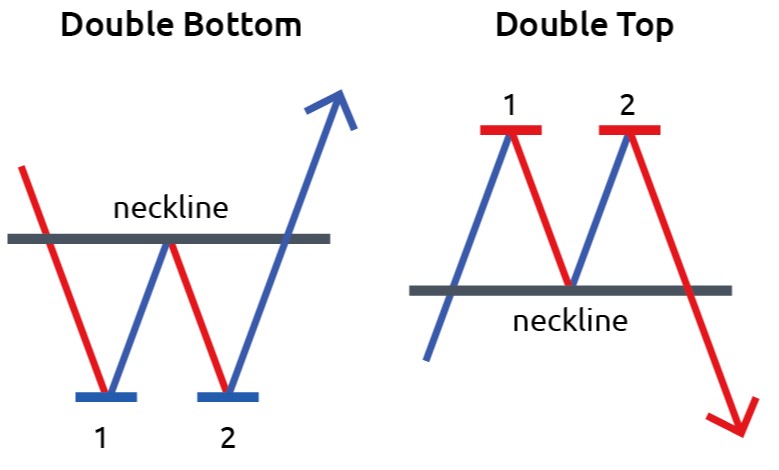
Screenshot_2-14.jpg 💥A double top is a technical chart pattern that occurs when the price of an asset reaches a high point, experiences a temporary decline, and then rallies back to approximately the...
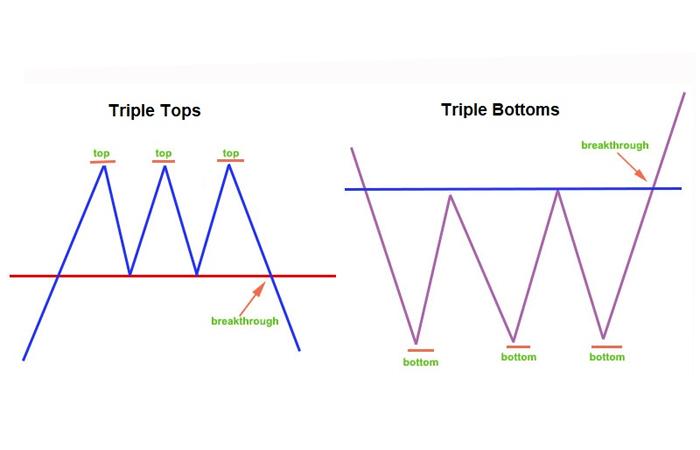
💥Triple Tops and Triple Bottoms are reversal patterns that appear on price charts. They occur when the price of an asset creates three consecutive peaks or troughs at approximately the same level. Tr...
💥The Head and Shoulders pattern is a popular reversal pattern in technical analysis. It is named after its appearance on the chart, which resembles a head with two shoulders. The pattern indicates a ...
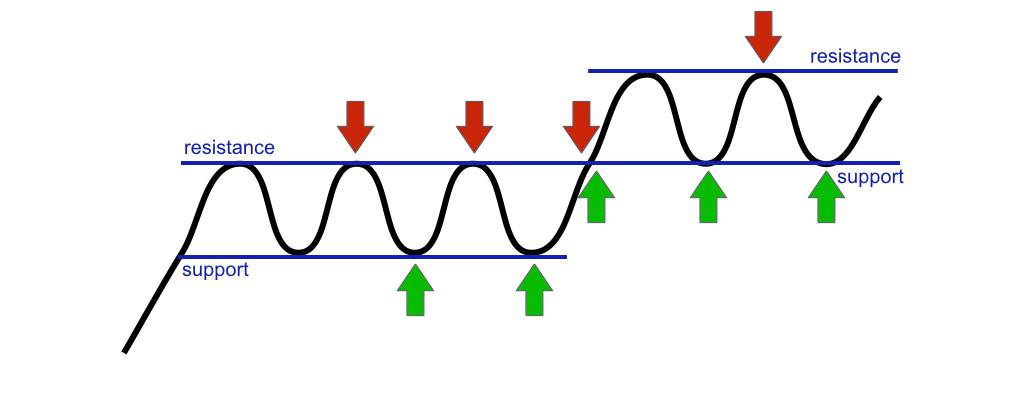
💥Support and resistance are two important concepts in trading that help traders identify potential price levels where an asset may experience buying or selling pressure. 💥Support refers to a price l...
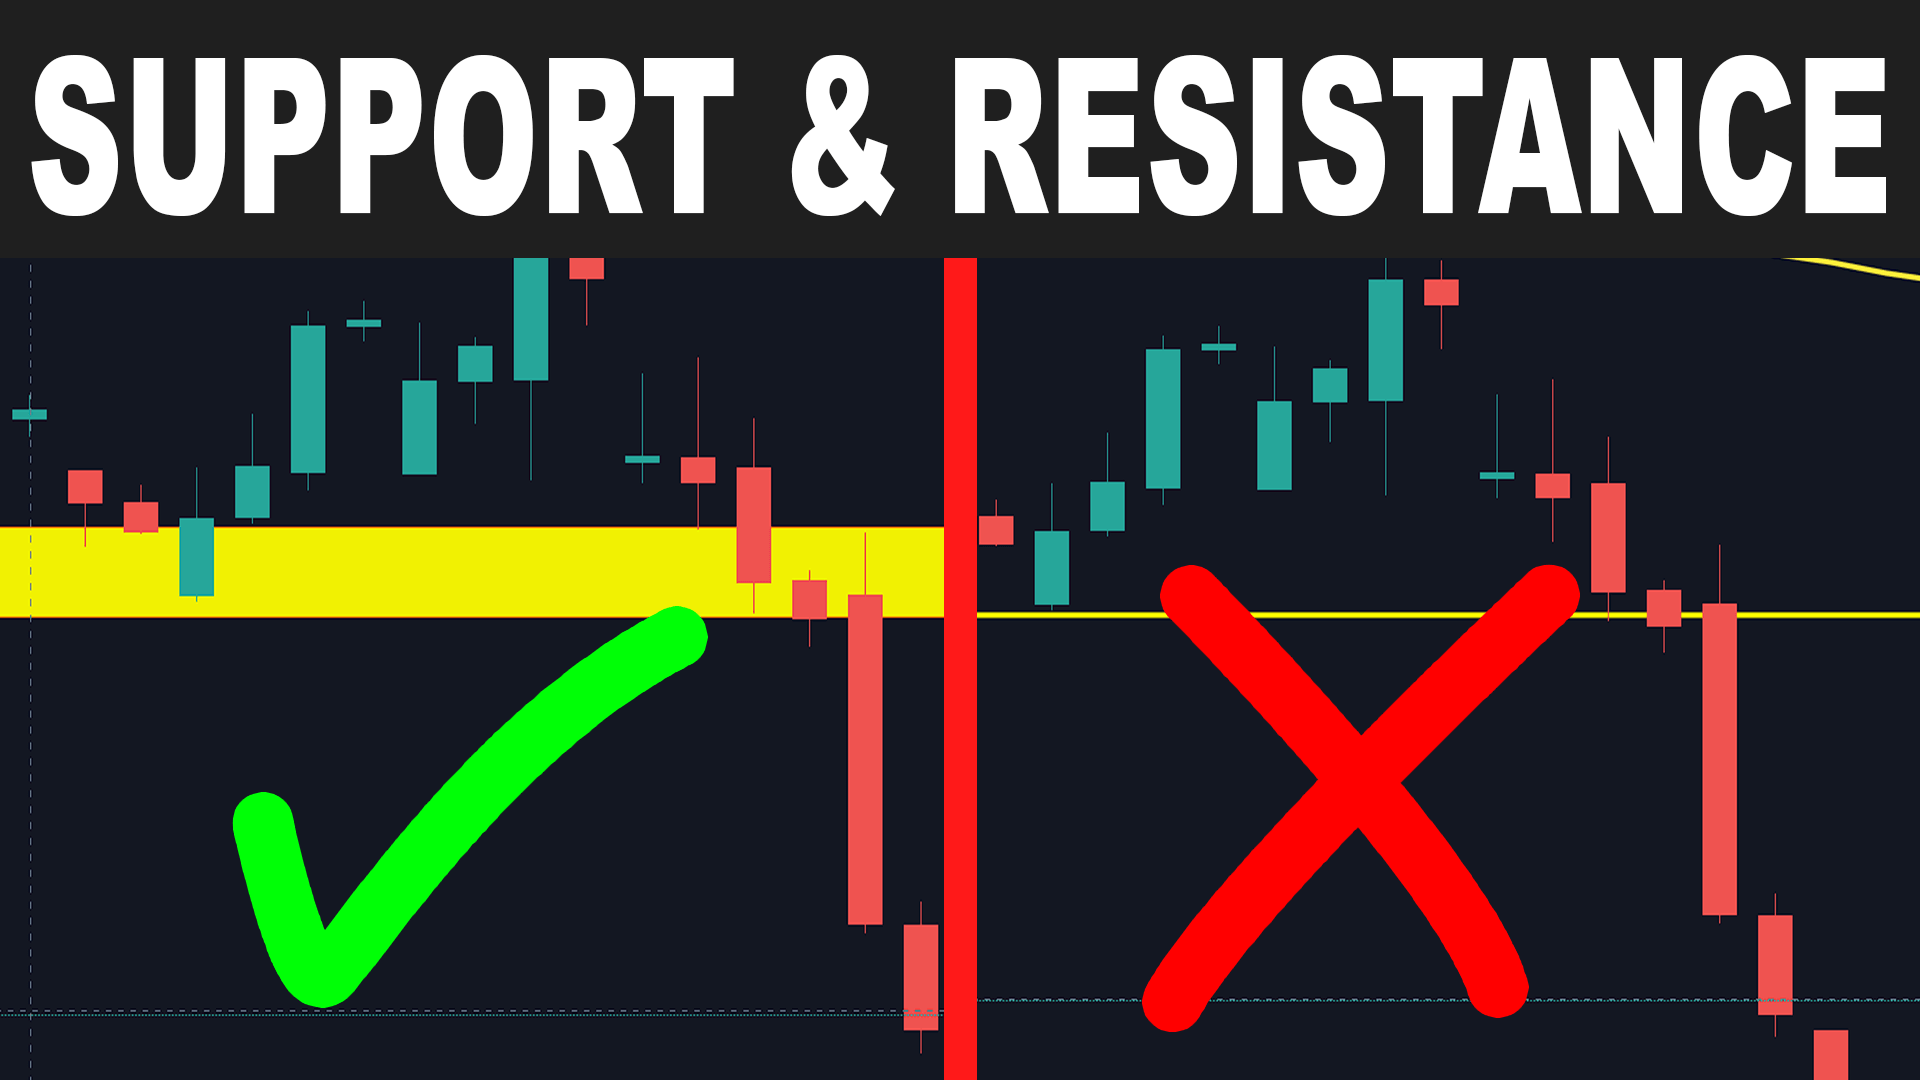
Support-and-Resistance-Trading-Strategy-Support-and-Resistance-intraday-trading-strategies-1001-Ichimoku-trading-2.png 💥Support and resistance levels are key concepts in technical analysis that can b...