

 Русский
 中文
中文
 Español
 Deutsch
 Português
 日本語
日本語
Any series
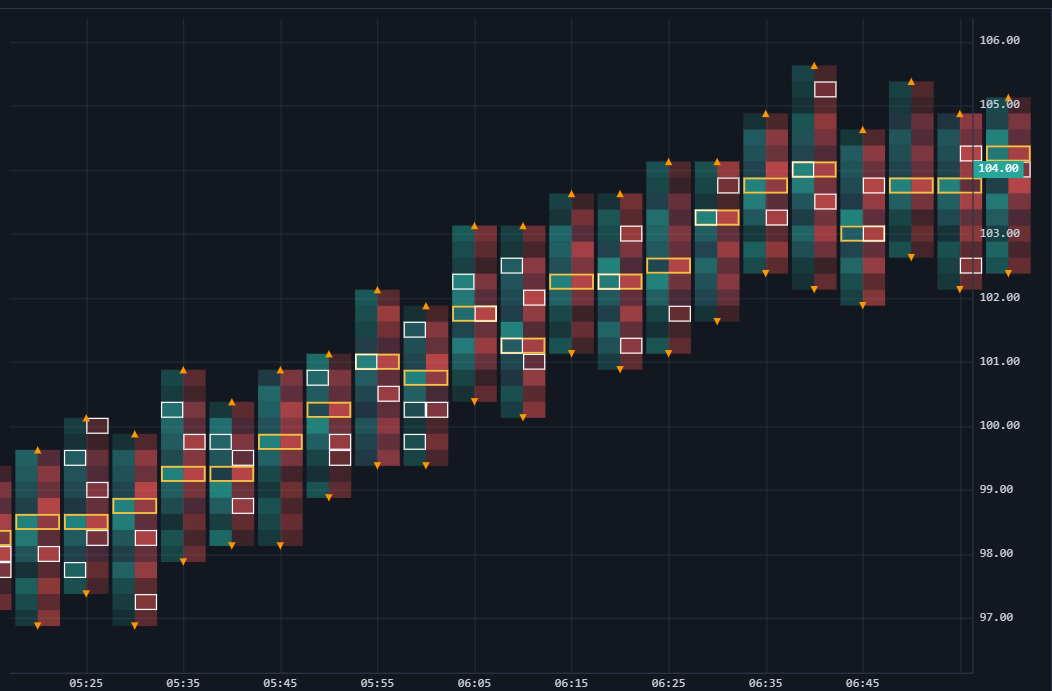
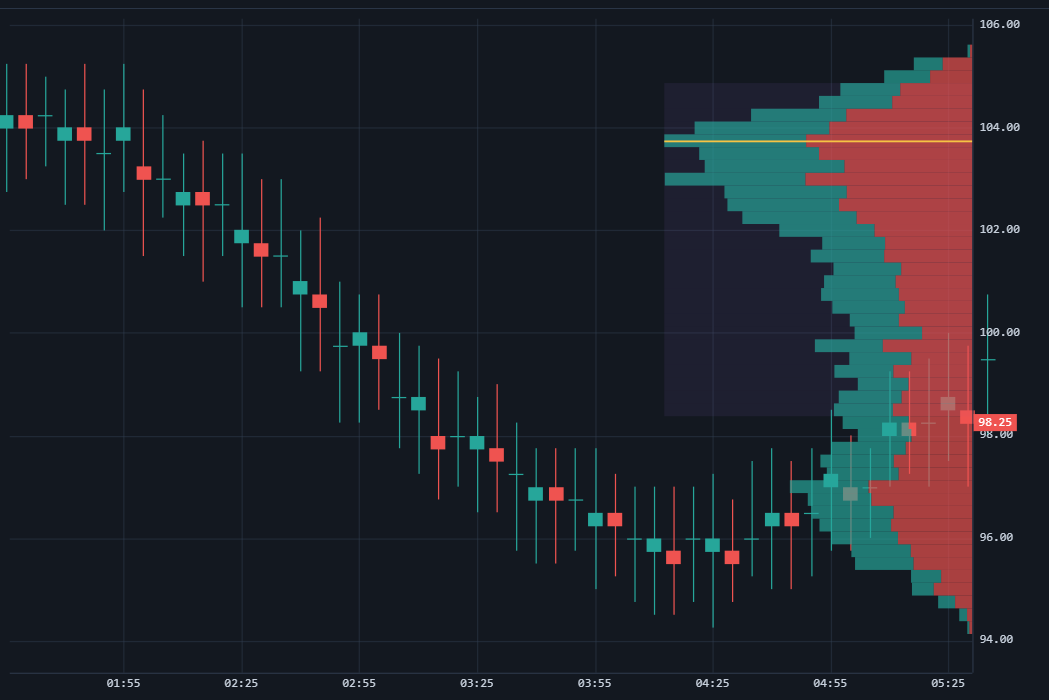
Candles, OHLC bars, line, area, histogram and band — plus the derived Heikin-Ashi, Renko and Point & Figure.
Chart JS — a canvas trading-chart library with not a single external dependency. It is the very engine that draws the charts in the StockSharp web terminal, packaged as a standalone embeddable compone...
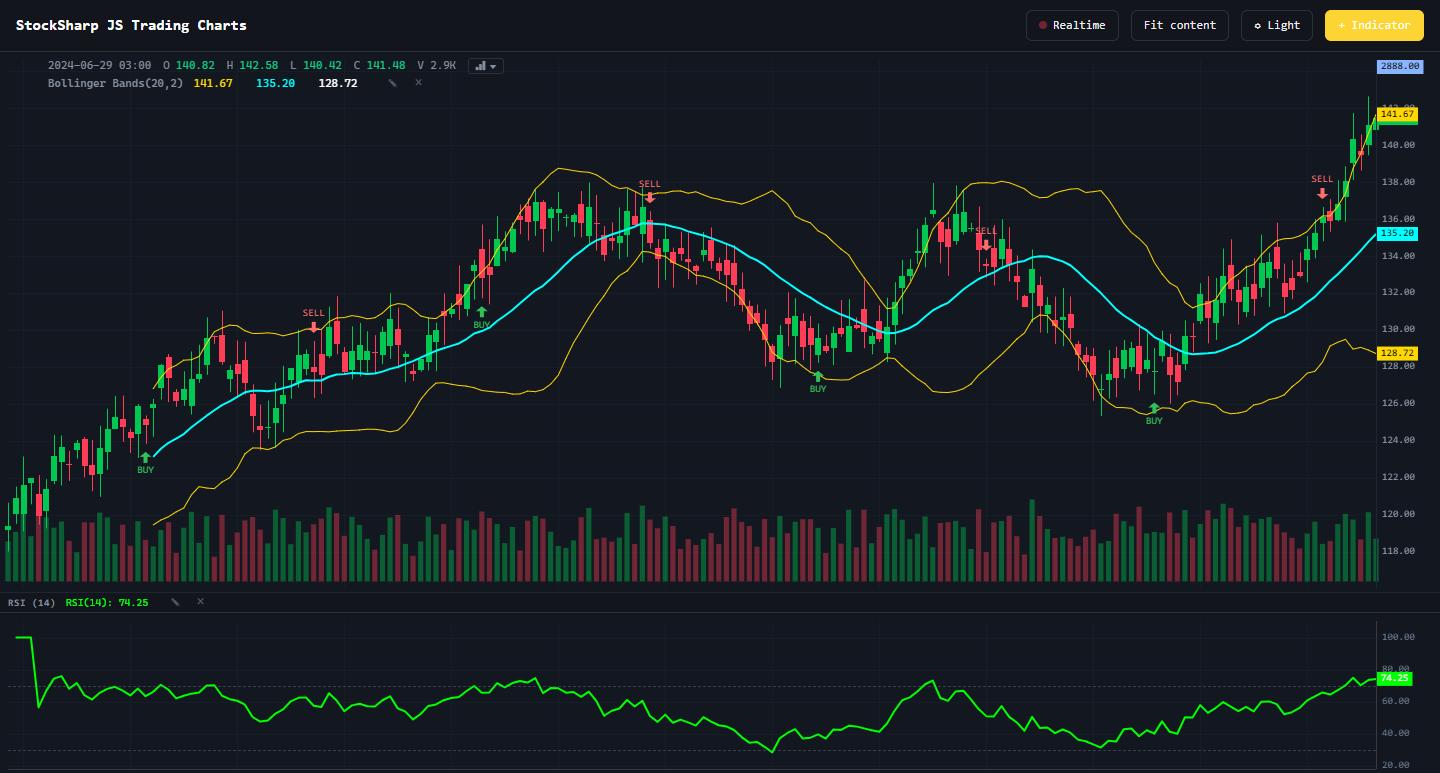
Chart JS — a canvas trading-chart library with not a single external dependency. It is the very engine that draws the charts in the StockSharp web terminal, packaged as a standalone embeddable component.
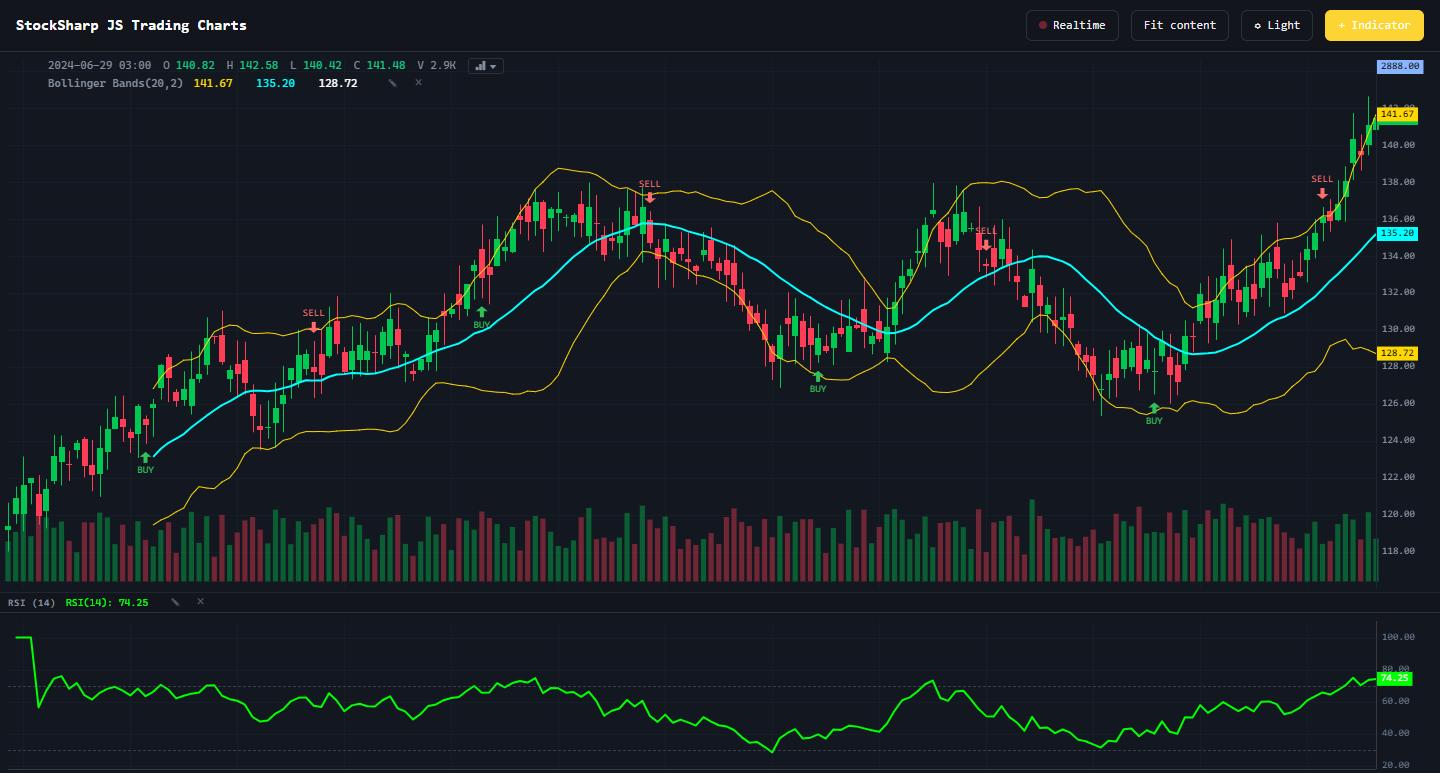
Candles, OHLC bars, line, area, histogram and band — plus the derived Heikin-Ashi, Renko and Point & Figure.
setData loads the history, update moves the last bar — without redrawing the whole chart.
Light and dark themes, a context menu, the indicator dialog and chart-type switching are already inside.
It loads with a <script> tag or as an ES module — a chart takes three lines:
import { createChart, CandlestickSeries } from '@stocksharp/chart';

const chart = createChart(document.getElementById('chart'), {
  timeScale: { timeVisible: true },
});

const candles = chart.addSeries(CandlestickSeries);
candles.setData(history);   // time is Unix seconds
candles.update(lastCandle); // and onwards as data arrives
I answer from what this page says. For anything else I will point you to the documentation.