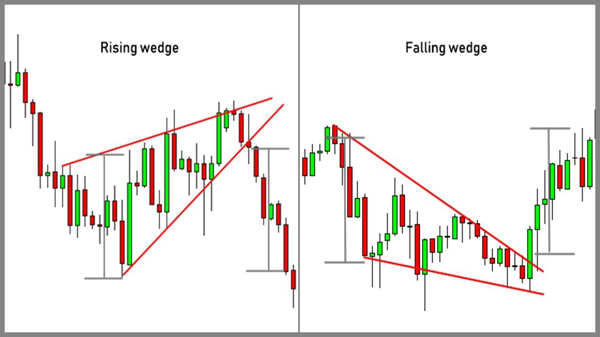
Continuous Patterns (Wedge)
💥A wedge is a chart pattern that signals a potential trend reversal or continuation. It can be either a rising wedge or a falling wedge. 💥A rising wedge is formed when the price consolidates between...
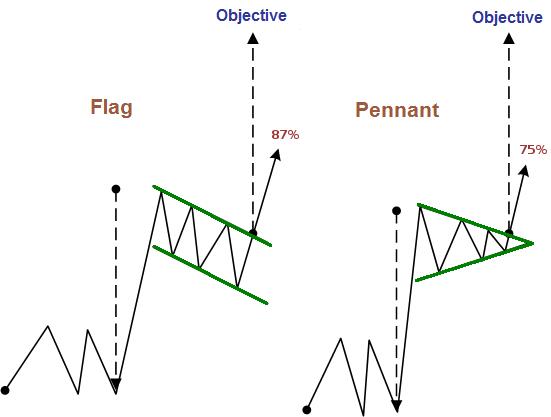
💥Flags and Pennants are two chart patterns that can occur during a trend, typically after a significant price movement. They are classified as continuation patterns as they suggest that the previous ...
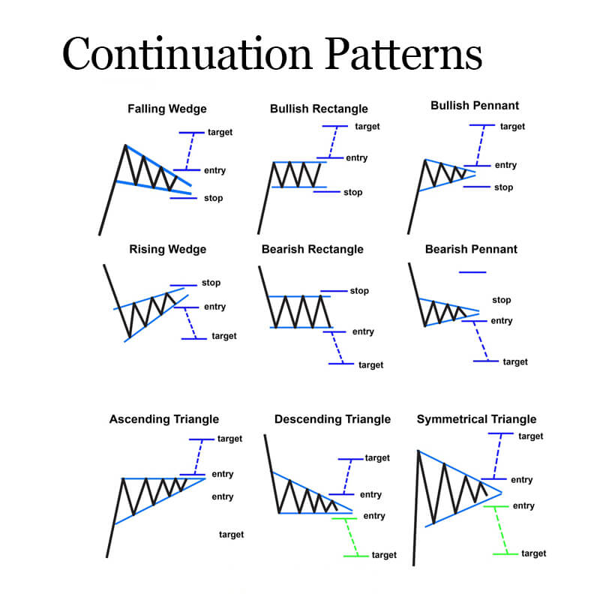
💥Continuous patterns are chart patterns that indicate that the price of an asset is likely to continue moving in the same direction as the current trend. These patterns are characterized by a series ...