Creating a strategy in the
Designer program.
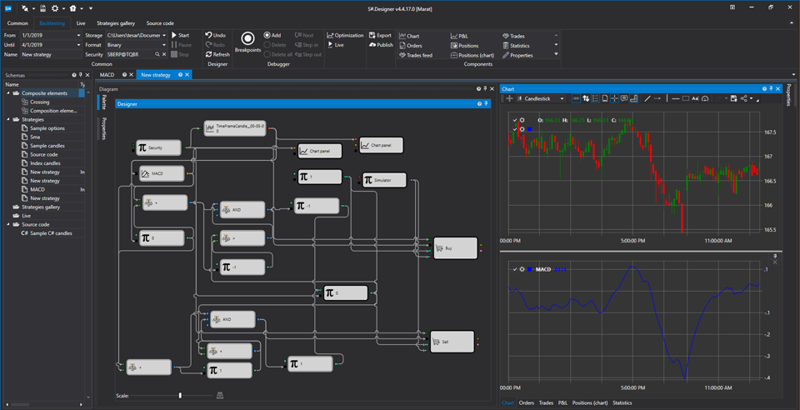
Let’s discuss an example of creating a trading strategy in a program based on the MACD indicator values.
The indicator’s goal is as follows:
1. If the MACD indicator histogram crosses the zero line from top to bottom, this is a sell signal.
2. The transition of the histogram from the negative to the positive zone is a buy signal.
Therefore, it is necessary to create conditions under which a trade will be made, namely, if the indicator value on the next candle changes its sign, then the signal is sent to make a trade.
To create a strategy, we need:
- Run the program.
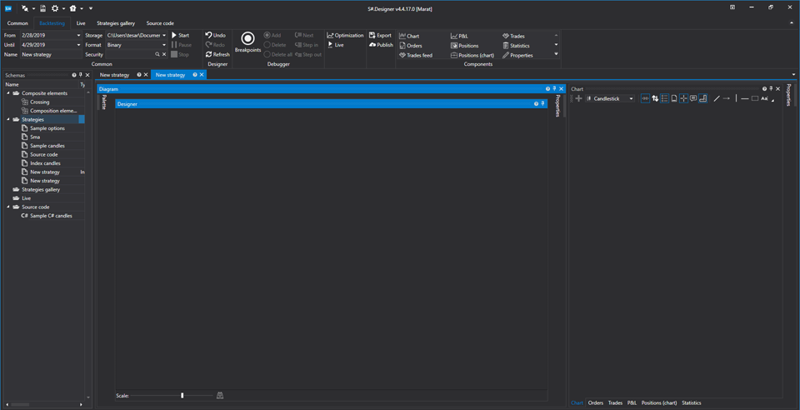
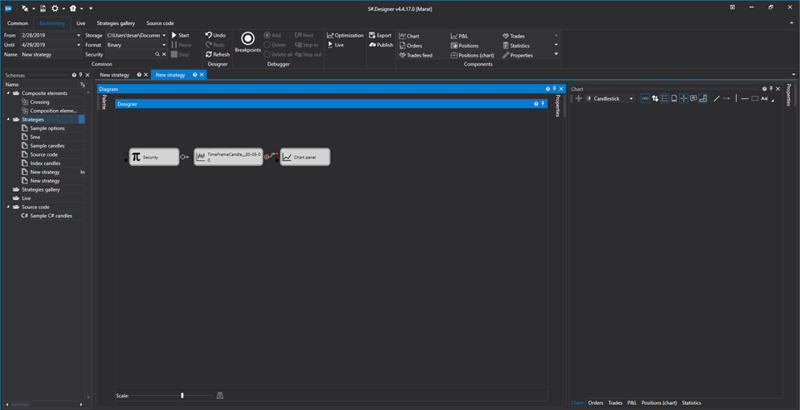
- Select the Variable, Candles and Chart Panel blocks, connect them.
- Select an instrument with which we will test the strategy.
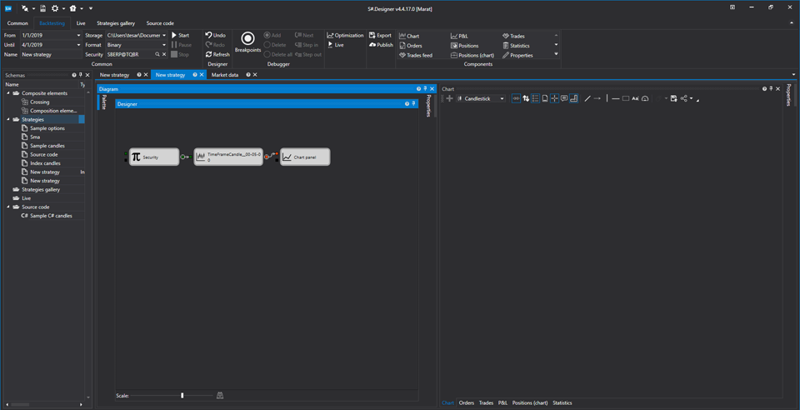
- Plot a candle chart.
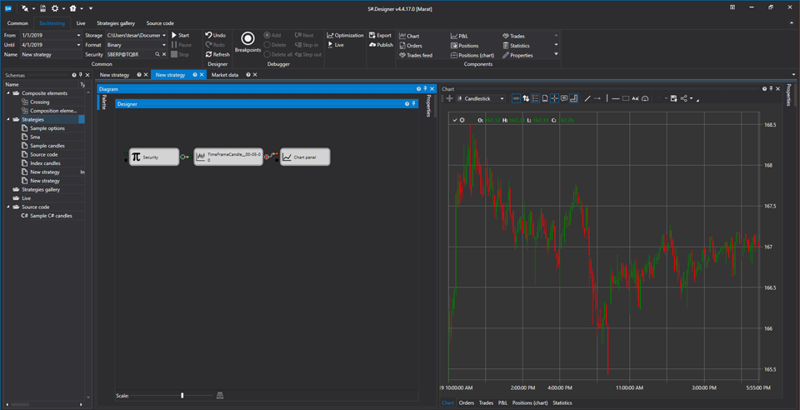
- Select the Indicator and Chart Panel blocks. Connect the Indicator and Candles blocks.
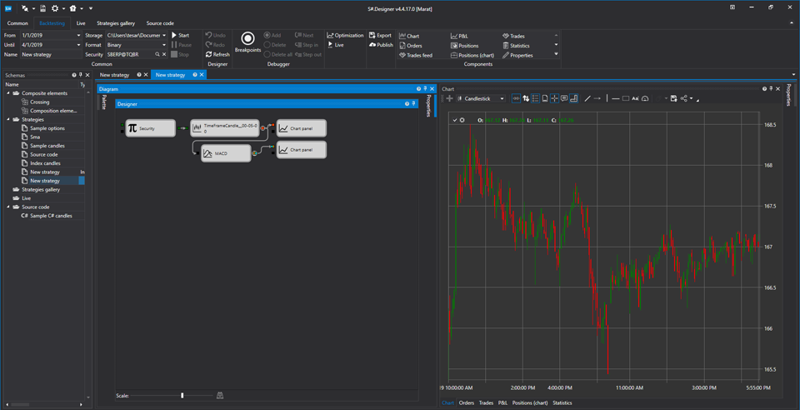
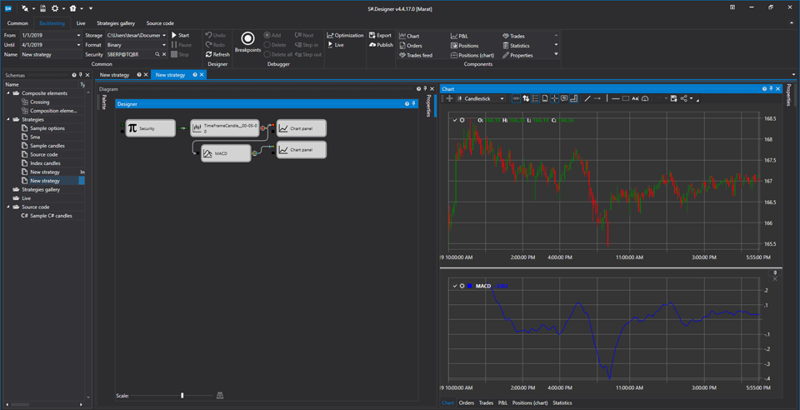
- Plot a chart of the MACD indicator.
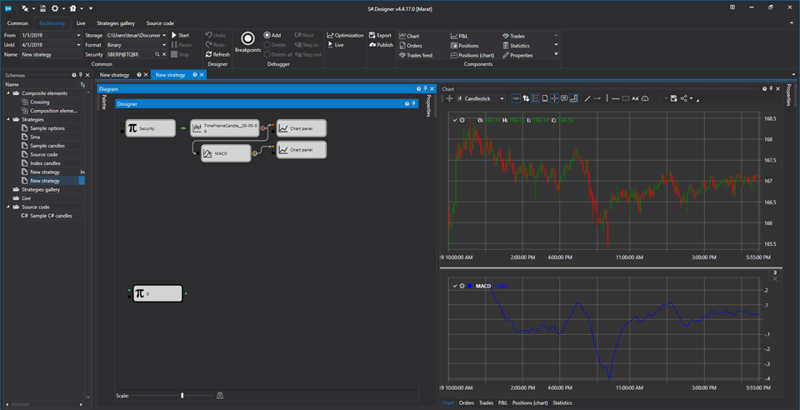
- Select the Variable block and assign it a numeric value of 0 for further comparison with the indicator value.
- Select the Comparison block and set the test condition in the properties: execution during the test, with the MACD indicator value greater than 0.
- Add two Variable blocks and Comparison block. One of the variables is set to -1 in the block properties. It will indicate the transition of the MACD curve value from negative to positive area. The second Variable value is set to 0 in the properties, that will indicate the initial indicator value.
- Set the condition in the Comparison block that will be fulfilled if the initial indicator value for the time frame is greater than the current one.
- Connect the Variable blocks via a trigger socket with the Comparison blocks, as shown in the figure.
Select the Logical Condition and Variable cubes.
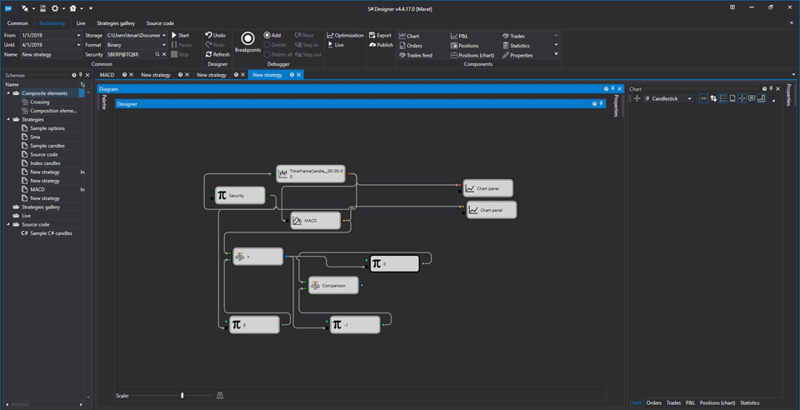
- The execution condition of two comparisons will be checked in the Logical Condition cube. Set the AND condition in the properties of the Logical Condition cube and connect the cubes as shown in the figure.
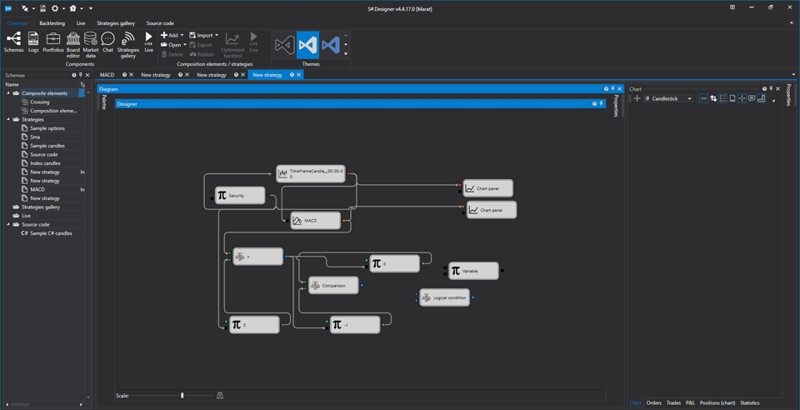
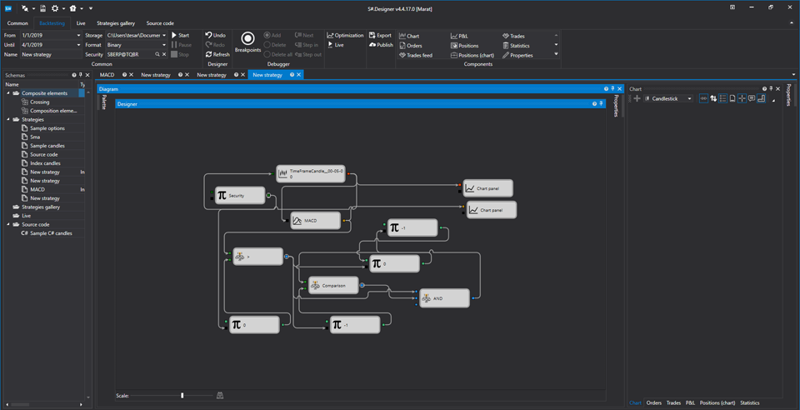
- Set the value equal to -1 in the Variable cube and connect it with the Logical Condition cube via a trigger socket, and through the output connect to the input of the cube with a value of 0. This will allow overwriting the checkbox value when conditions are met, indicating within what range of values the MACD indicator curve is.
- Select the Open Position block, select the Buy direction in the settings and connect data and trigger with the socket, as shown in the figure.
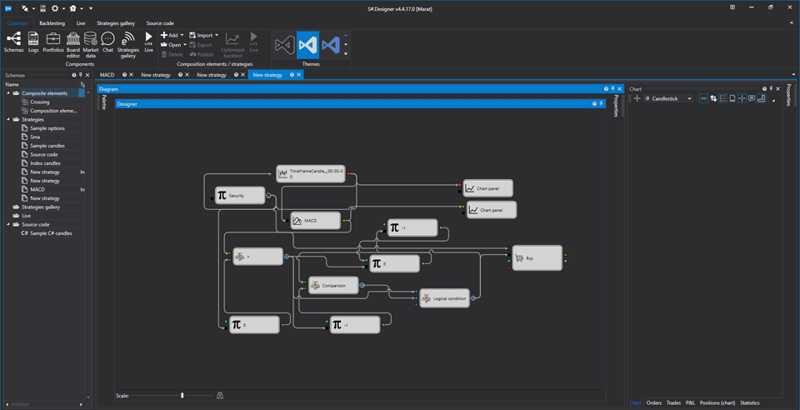
- Select two Variable blocks in which to set the volume and portfolio for trading. Connect them with the corresponding sockets of the Open Position block.
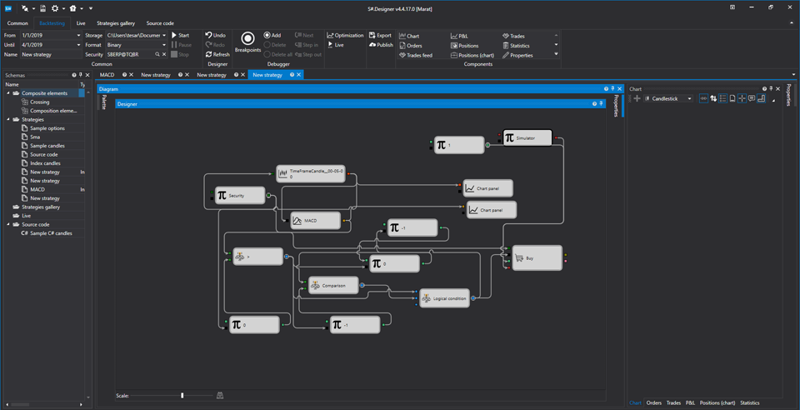
- Similarly, create a routine for the Sales execution.
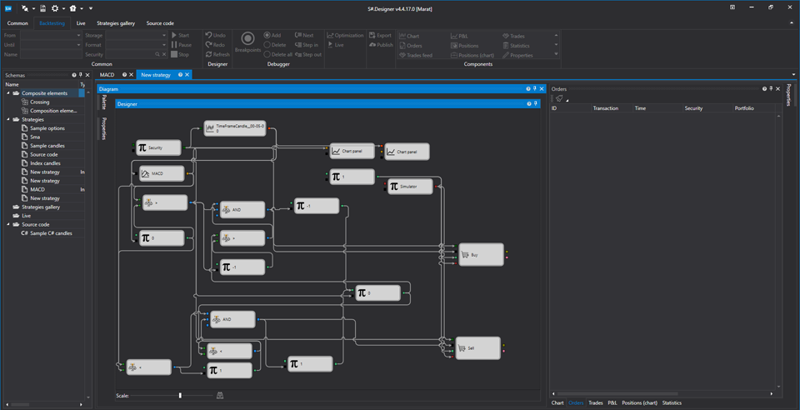
-The strategy is ready, let’s run it.
