

 Русский
 中文
中文
 Español
 Deutsch
 Português
 日本語
日本語

We are excited to introduce chart updates in Terminal that significantly improve market data analysis and make trading more convenient. The update enhances the Box Chart and Cluster Chart with separate buy and sell volumes, dynamic price grouping steps, and percentage-based steps for XO and Renko charts. Let's take a closer look at these new features.
Box Chart
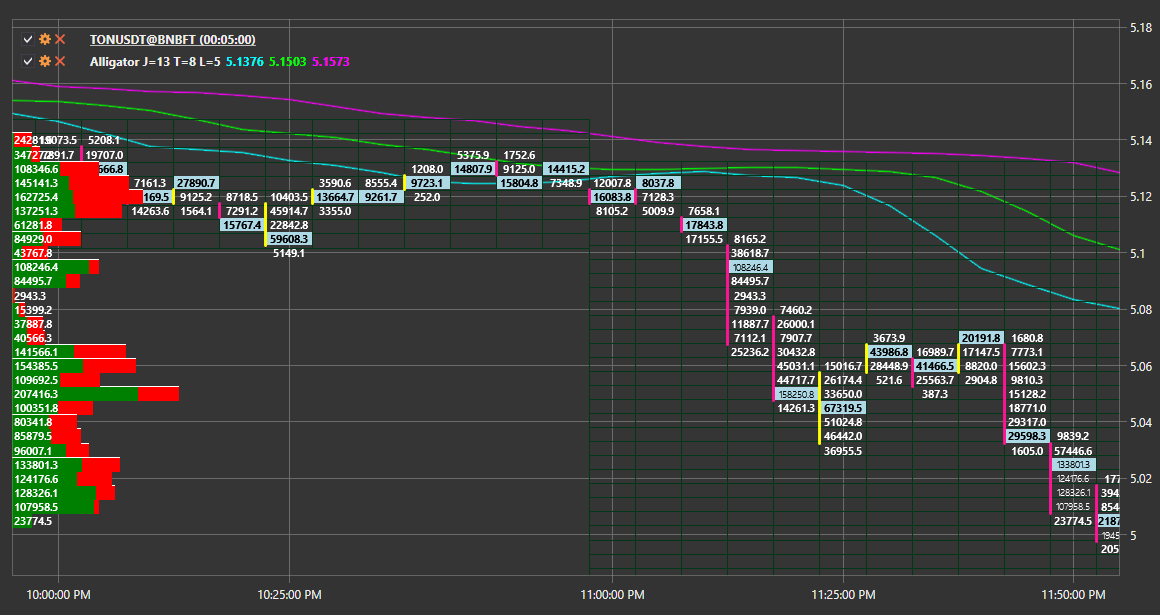
Buy and sell volumes are now displayed separately, making market sentiment easier to analyze. Color coding helps you interpret the data quickly.
Cluster Chart
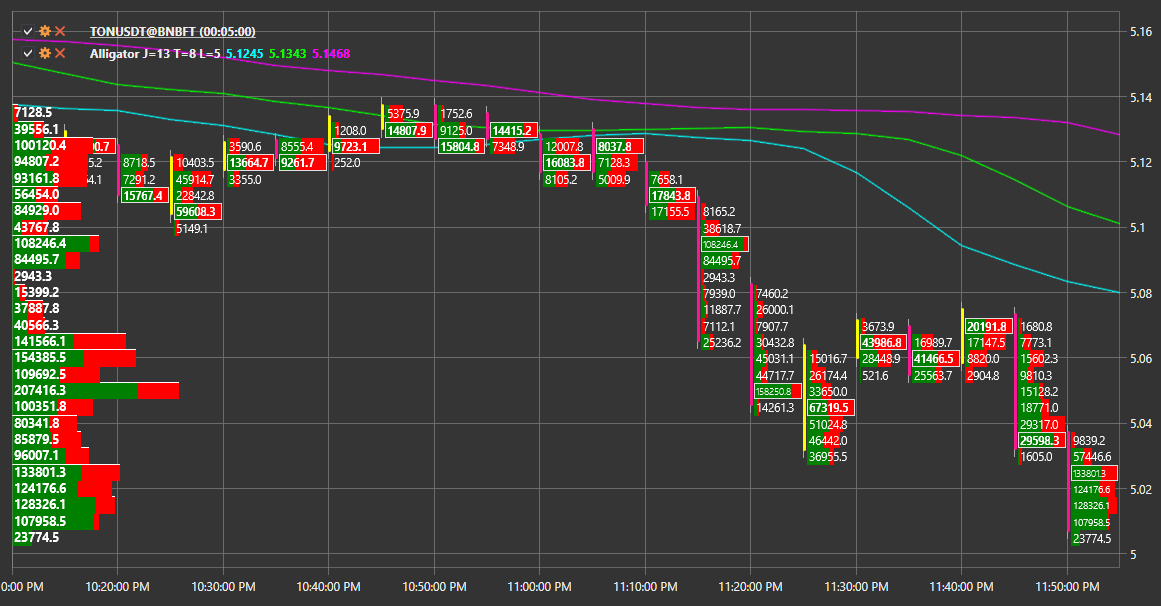
Separating buy and sell volumes enables more accurate volume analysis at each price level.
Dynamic Price Grouping Step Support
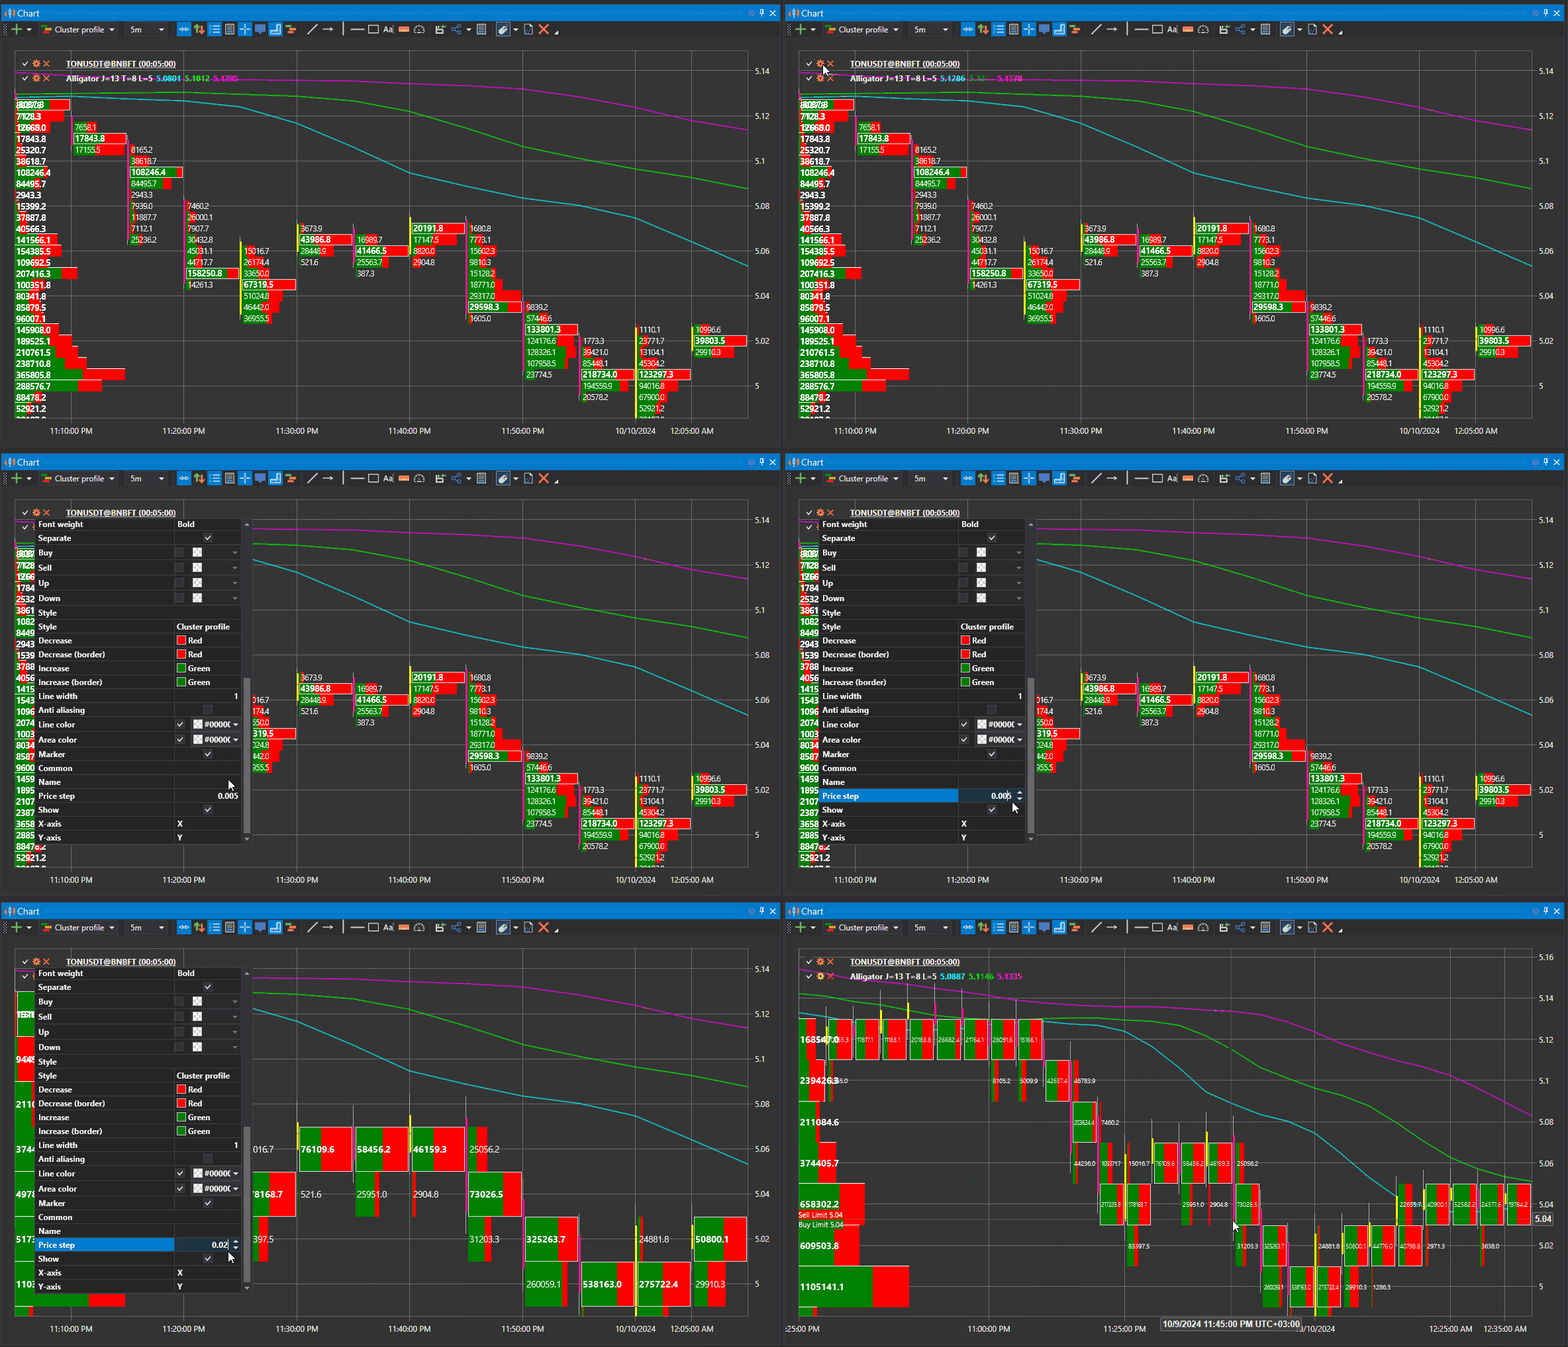
The dynamic price grouping step now adjusts automatically to market activity. This is particularly useful for instruments with small price increments, such as cryptocurrencies.
Percentage Step Support for XO and Renko
You can now define price changes as percentage-based steps in XO and Renko charts, making these charts more flexible when analyzing volatile assets such as cryptocurrencies and stocks.
Benefits of the Update
- Separate buy and sell volumes for more accurate market analysis.
- Dynamic price grouping steps for assets with small price changes, such as cryptocurrencies.
- Percentage-based steps for XO and Renko charts, allowing them to adapt to different market conditions.
Conclusion
The new chart features in Terminal give traders greater flexibility and accuracy when analyzing market data. Enhanced Box and Cluster charts with separate buy and sell volumes, dynamic price grouping steps, and percentage-based steps for XO and Renko will help you analyze the market and make more informed trading decisions. Try the updated charts today and experience the benefits of the new functionality!
Comments (0)
Login or Create account, Log in or register to leave a comment
No comments yet. Be the first!