

 Русский
 中文
中文
 Español
 Deutsch
 Português
 日本語
日本語

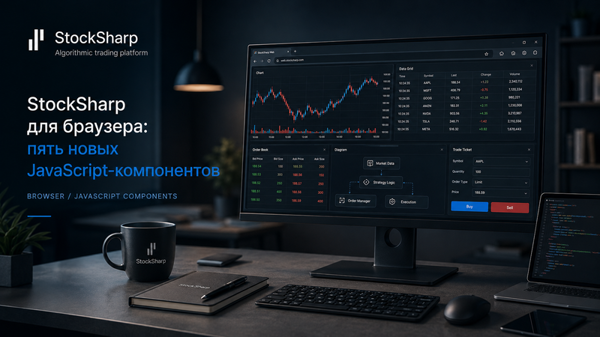
Building a web trading interface no longer has to start with charts, grids, and an order book written from scratch. We have released a standalone StockSharp JavaScript product line that can be embedded into custom terminals, trading applications, analytics systems, and educational tools.
It includes five components:
- JS-Charts (
@stocksharp/chart) — trading charts with multiple panels, custom series, footprint charts, Volume Profile, TPO, and a trading layer; - JS-Indicators (
@stocksharp/indicators) — approximately 165 indicators with batch and sequential calculation; - JS-Diagram (
@stocksharp/diagram) — an embeddable diagram editor for trading strategies; - JS-Grids (
@stocksharp/grids) — data grids with sorting, filtering, grouping, state persistence, and XLSX export; - JS-TradingControls (
@stocksharp/trading-controls) — trading controls for orders, positions, trades, order books, time and sales, instrument lists, and order entry.
All five components are published as npm packages and integrate through typed APIs and host interfaces. JS-Charts and JS-TradingControls are not tied to a particular execution venue or data transport: the host application supplies market data and processes trading commands through its own server-side layer.
JS-Indicators also includes a machine-readable indicator catalog and checks its results against the implementations in the C# platform. This makes it easier to move trading logic between the server side and the browser.
The components can be explored directly in a browser:
All repositories include source code, documentation, and integration examples.
Comments (0)
Login or Create account, Log in or register to leave a comment
No comments yet. Be the first!