Continuous Patterns (Rectangle)
💥A rectangle is a chart pattern that signals a period of consolidation in the price movement of an asset. The pattern is formed when the price moves between parallel support and resistance levels, cr...
💥A wedge is a chart pattern that signals a potential trend reversal or continuation. It can be either a rising wedge or a falling wedge. 💥A rising wedge is formed when the price consolidates between...
💥Flags and Pennants are two chart patterns that can occur during a trend, typically after a significant price movement. They are classified as continuation patterns as they suggest that the previous ...
💥A descending triangle is a chart pattern in technical analysis that is formed when the price of an asset moves within a converging range, with a downward-sloping trend line at the top and a horizont...
💥V-shape is a chart pattern that signals a potential reversal in the trend of an asset. As the name suggests, the pattern looks like the letter "V". 💥The V-shape pattern occurs when an asset's price...
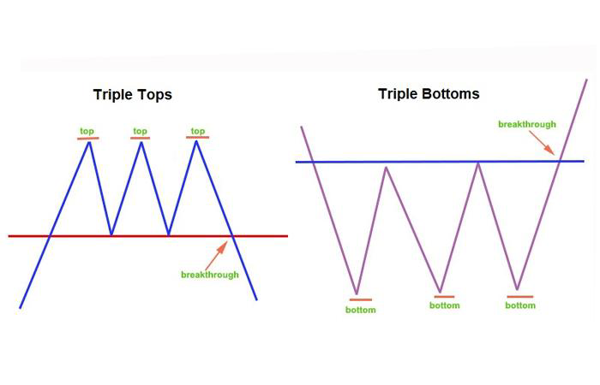
💥Triple Tops and Triple Bottoms are reversal patterns that appear on price charts. They occur when the price of an asset creates three consecutive peaks or troughs at approximately the same level. Tr...