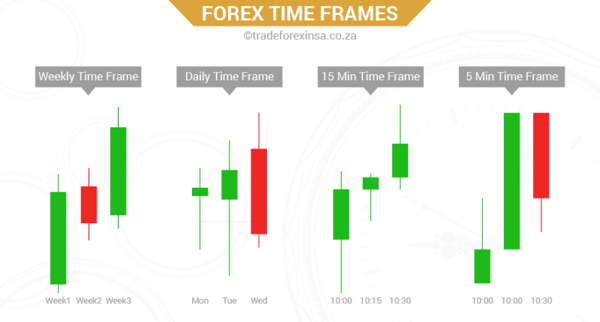
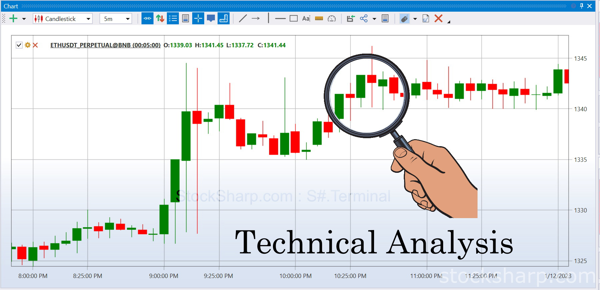
What is Timeframe in technical analysis?
Forex_Time_Frames-01.png 💥In technical analysis, the timeframe refers to the specific period or duration of time that is represented on a price chart. It determines the granularity or level of detail...
Point-and-Figure-Chart-7.png image-25.png 💥The Point-and-Figure diagram is a popular tool among technical analysts and traders for charting price movements in financial markets. It is a type of chart...
9eb85c0b550e1877ce51e70db80f52ea--to-read-charts.jpg d0abd6ee-f31c-4e01-95dc-cd03de9f4eae.png b09223ca-7e94-42ac-b1e7-a769735a6b19.png Point-Figure-Chart-Explained.jpg In Point-and-Figure charting, tr...
1*03ly9-LoF1WLHXsxPcVEPQ.png 💥Point-and-Figure (P&F) diagrams are a type of chart used in technical analysis to plot price movements without regard to time. The chart is made up of a grid of X's and ...
💥Common gaps are formed when there is a slight pause in trading activity or a trading range, and the price opens above or below the previous day's closing price without any significant news or events...
💥Gaps are a common phenomenon in financial markets that can indicate significant price movements. A gap occurs when there is a difference between the closing price of a trading day and the opening pr...
💥A symmetric triangle is a type of continuous pattern in technical analysis that occurs when the price of an asset moves within a converging range, forming two trend lines that meet at a point. This ...
💥Continuous patterns are chart patterns that indicate that the price of an asset is likely to continue moving in the same direction as the current trend. These patterns are characterized by a series ...