Русский
 中文
中文
 Español
 Deutsch
 Português
 日本語
日本語
👁 1,875
💬 1
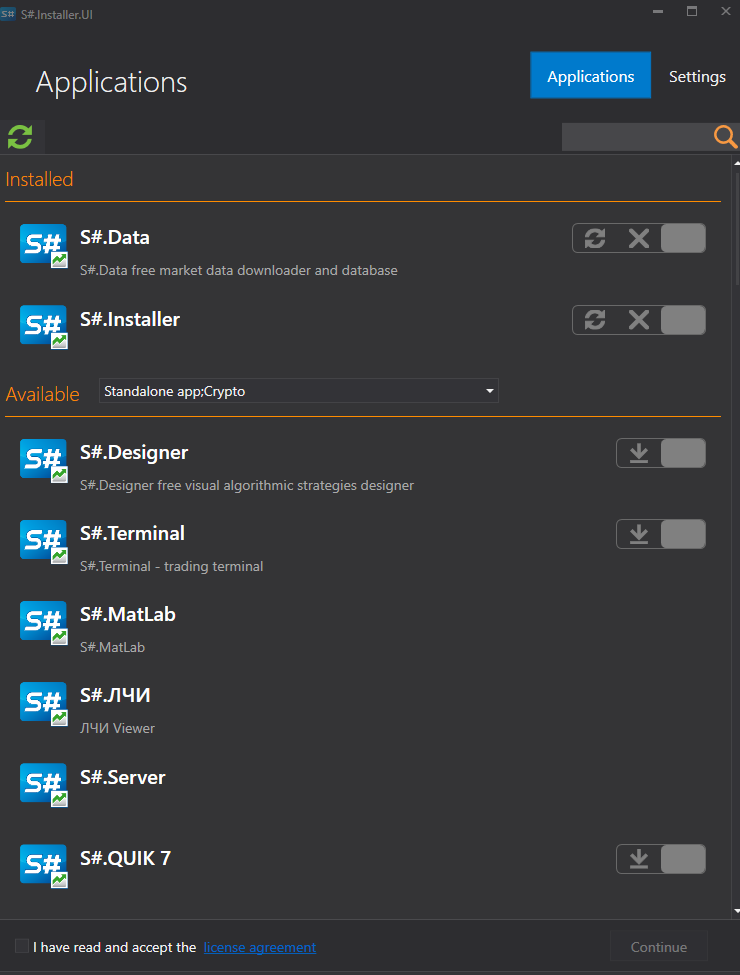
Downloading the US market data via Hydra
In our today's article, we will talk about where to go for free or for a relatively small amount of money to download historical data on the US market, as well as about a universal way to download, st...