| 0 |
| Votes |
|
| 0 |
| Answers |
|
| 63 |
| Views |
|
💥💥Trading robots, also known as automated trading systems or algorithmic trading systems, are computer programs that execute trades based on pre-def...
|

5/19/2023
To last
|
|
| 0 |
| Votes |
|
| 0 |
| Answers |
|
| 66 |
| Views |
|
💥💥Pattern recognition is a technique used in quantitative analysis to identify and analyze patterns in market data, such as price movemen...
|

5/13/2023
To last
|
|
| 0 |
| Votes |
|
| 0 |
| Answers |
|
| 79 |
| Views |
|
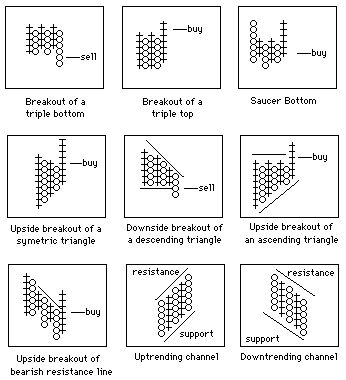
💥The Point-and-Figure diagram is a popular tool among technical analysts and traders for chart...
|

12/5/2022
To last
|
|
| 0 |
| Votes |
|
| 0 |
| Answers |
|
| 75 |
| Views |
|
[center]   [img=135956]b09223ca-7e94-42ac-b1e7-a769735a6b19.png[/...
|

12/4/2022
To last
|
|
| 0 |
| Votes |
|
| 0 |
| Answers |
|
| 80 |
| Views |
|
💥Point-and-Figure (P&F) diagrams are a type of chart used in technical analysis to plot price movements without regard to time. The ...
|

11/29/2022
To last
|
|
| 0 |
| Votes |
|
| 0 |
| Answers |
|
| 75 |
| Views |
|
💥Common gaps are formed when there is a slight pause in trading activity or a trading range, and the price opens above or below the previous day's closing price without any significant news or events...
|

11/25/2022
To last
|
|
| 0 |
| Votes |
|
| 0 |
| Answers |
|
| 87 |
| Views |
|
💥Gaps are a common phenomenon in financial markets that can indicate significant price movements. A gap occurs when there is a difference between the closing price of a trading day and the opening pr...
|

11/22/2022
To last
|
|
| 0 |
| Votes |
|
| 0 |
| Answers |
|
| 80 |
| Views |
|
💥A symmetric triangle is a type of continuous pattern in technical analysis that occurs when the price of an asset moves within a converging range, forming two trend lines that meet at a point. This ...
|

11/13/2022
To last
|
|
| 0 |
| Votes |
|
| 0 |
| Answers |
|
| 104 |
| Views |
|
💥Continuous patterns are chart patterns that indicate that the price of an asset is likely to continue moving in the same direction as the current trend. These patterns are characterized by a series ...
|

11/12/2022
To last
|
|
| 0 |
| Votes |
|
| 0 |
| Answers |
|
| 84 |
| Views |
|
💥Support and resistance levels are key con...
|

11/4/2022
To last
|